Content
Published:
This is an archived release.
Drop in exports of crude oil
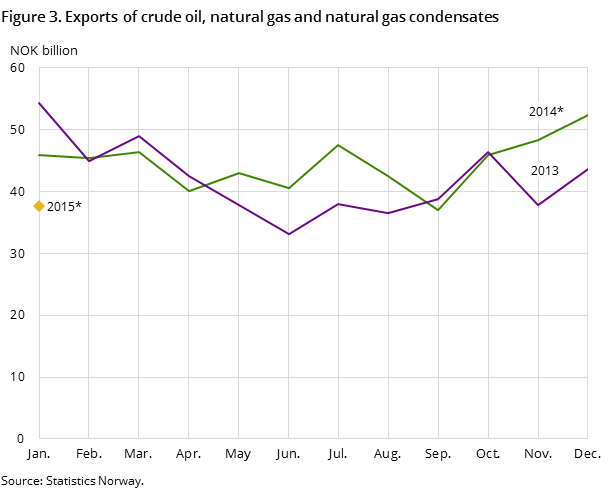
Export of goods amounted to NOK 71.6 billion in the first month of 2015. This is a decline of 20.9 per cent compared with the corresponding month last year. The decrease was primarily due to lower exports of crude oil, which decreased by NOK 16 billion and amounted to NOK 13.2 billion in January 2015.
| NOK Million | Change in per cent | ||
|---|---|---|---|
| January 2015 | December 2014 - January 2015 | January 2014 - January 2015 | |
| 1The figures are marked with the symbol *. This is Statistics Norways standard symbol for indicating preliminary figures. | |||
| 2Due to the data collection method, the preliminary monthly figures published for ships and oil platforms are often incomplete. In retrospect, therefore, the trade in these goods could in some cases lead to major corrections in the figures. Please see tables 2-4 for the impact these figures have on the external trade. | |||
| Imports | 44 477 | -4.6 | 4.6 |
| Imports of ships and oil platforms2 | 323 | -36.4 | -34.6 |
| Exports | 71 577 | -6.7 | -20.9 |
| Crude oil | 13 155 | -24.5 | -54.8 |
| Natural gas | 24 091 | -6.3 | -2.0 |
| Natural gas condensates | 373 | -22.7 | -36.2 |
| Ships and oil platforms2 | 730 | -19.3 | -67.1 |
| Mainland exports | 33 229 | 3.1 | -2.2 |
| The trade balance | 27 100 | -10.1 | -43.5 |
| The mainland trade balance | -10 925 | -21.3 | 35.4 |
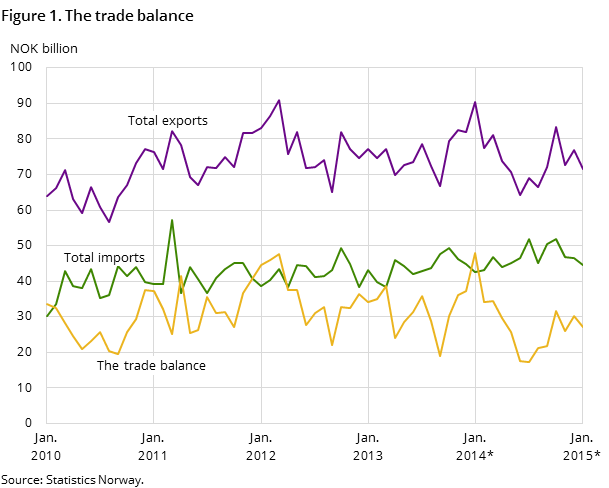
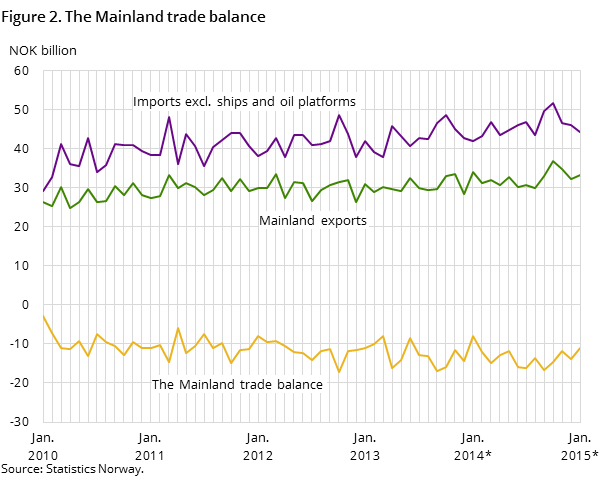
Imports amounted to NOK 44.5 billion in January, up 4.6 per cent compared with the same month the previous year. The trade surplus in January fell considerably, with a decrease of 43.5 per cent, and ended at NOK 27.1 billion. Decreases in natural gas and mainland exports also helped drive down profits.
Sharp decline in exports of crude oil
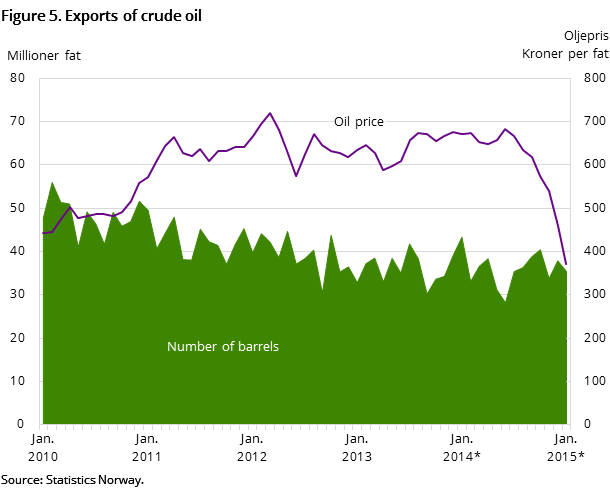
The value of crude oil exports amounted to NOK 13.2 billion in January 2015. This is less than half the value from the corresponding month last year, when crude oil to the value of NOK 29.1 billion was exported. This is the lowest export value of crude oil since November 2001. The decrease is mainly due to a weakening of the oil price from NOK 671 to NOK 371 from January 2014 to January 2015. This is a decrease of 44.7 per cent. A total of 35.5 million barrels of crude oil were exported in January 2015; a decline of 7.9 million barrels from the corresponding month last year. Bad weather on the continental shelf in January played a major role in causing the low production volumes.
Exports of natural gas amounted to NOK 24.1 billion in January; a decrease of 2 per cent compared to January 2014. A total of 9.7 billion cubic metres of natural gas in gaseous state were shipped abroad - an increase of 4.4 per cent from January the previous year.
Increased exports of machinery
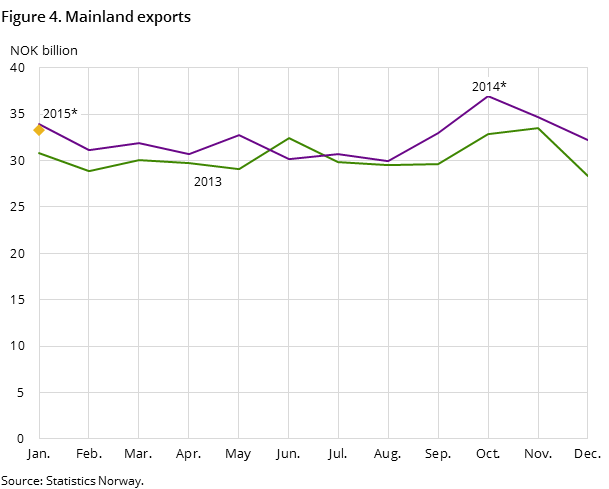
Mainland exports amounted to NOK 33.2 billion in the first month of the year. This is a decrease of 2.2 per cent compared with January 2014.
Exports of machinery and transport equipment increased by over NOK 1.7 billion and amounted to NOK 10.1 billion in January. The subgroups other industrial machinery and electrical machinery rose the most, by 82 per cent and 127.1 per cent respectively, and totalled NOK 3.2 billion and NOK 2.3 billion. The increase can be attributed to the shipment of goods for several large projects in January. The subgroup other transport equipment declined the most from NOK 2.5 billion in 2014 to NOK 1.1 billion in January 2015.
Fish worth NOK 5.5 billion were exported in January. This is a decrease of 4.6 per cent compared with January 2014. Exports of fresh whole salmon decreased by nearly NOK 120 million, but also fewer exports of frozen cod and herring contributed to the decline in fish exports. Cod fishing is delayed this year and is reflected in the export figures.
Exports of refined mineral fuels amounted to NOK 2.4 billion in January. This is a reduction by more than half compared to the corresponding month last year when goods worth NOK 5.1 billion were exported. During January, manufactured goods totalling NOK 6.6 billion were shipped abroad - an increase of 9.6 per cent compared with last year. The subgroup metals except iron and steel had the greatest increase. Here exports increased by more than NOK 490 million and amounted to NOK 3.9 billion. The increase here is partly due to higher aluminium prices.
Increased imports of crude materials
Total imports in January totalled NOK 44.5 billion. This is an increase of NOK 1.9 billion or 4.6 per cent compared to January 2014.
Imports of the main commodity group crude materials increased the most, by NOK 1.3 billion to NOK 3.5 billion. The subgroup metalliferous ores and metal scrap accounted for most of the increase - rising from NOK 1.4 billion to NOK 2.5 billion from January 2014 to January 2015.
Otherwise, imports of the main commodity groups chemical products and miscellaneous manufactured goods rose significantly. These groups increased by 18.9 and 10.1 per cent respectively to NOK 4.9 billion and NOK 7.3 billion.
Mineral fuels, lubricants and related materials decreased by 26.9 per cent to NOK 2.1 billion.
Contact
-
Information services external trade
E-mail: utenrikshandel@ssb.no
-
Nina Rolsdorph
E-mail: nina.rolsdorph@ssb.no
tel.: (+47) 41 51 63 78
-
Jan Olav Rørhus
E-mail: jan.rorhus@ssb.no
tel.: (+47) 40 33 92 37
