Content
Published:
This is an archived release.
Considerable imports in July
Imports of goods reached NOK 43.6 billion in July, while exports amounted to NOK 68.9 billion. This resulted in a trade surplus of NOK 22.6 billion; NOK 13.2 billion lower than the same month in 2013.
| NOK Million | Change in per cent | NOK Million - so far this year | Change in per cent - so far this year | ||
|---|---|---|---|---|---|
| July 2014 | June 2014 - July 2014 | July 2013 - July 2014 | July 2014 | July 2013 - July 2014 | |
| 1The figures are marked with the symbol *. This is Statistics Norways standard symbol for indicating preliminary figures. | |||||
| 2Due to the data collection method, the preliminary monthly figures published for ships and oil platforms are often incomplete. In retrospect, therefore, the trade in these goods could in some cases lead to major corrections in the figures. Please see tables 2-4 for the impact these figures have on the external trade. | |||||
| Imports | 46 288 | 0.6 | 7.8 | 312 814 | 5.6 |
| Ships and oil platforms2 | 27 | -86.5 | -92.4 | 1 927 | -60.4 |
| Exports | 68 873 | 8.4 | -12.5 | 523 322 | 0.0 |
| Crude oil | 23 598 | 22.4 | -14.2 | 163 644 | 2.0 |
| Natural gas | 13 766 | 5.1 | -28.4 | 129 707 | -9.5 |
| Natural gas condensates | 643 | 94.2 | -21.0 | 4 798 | -5.1 |
| Ships and oil platforms2 | 72 | -88.0 | -94.5 | 4 711 | 17.2 |
| Mainland exports | 30 795 | 2.0 | 3.3 | 220 463 | 4.6 |
| The trade balance | 22 585 | 29.1 | -36.8 | 210 508 | -7.4 |
| The mainland trade balance | -15 466 | 1.1 | -21.2 | -90 425 | -12.3 |
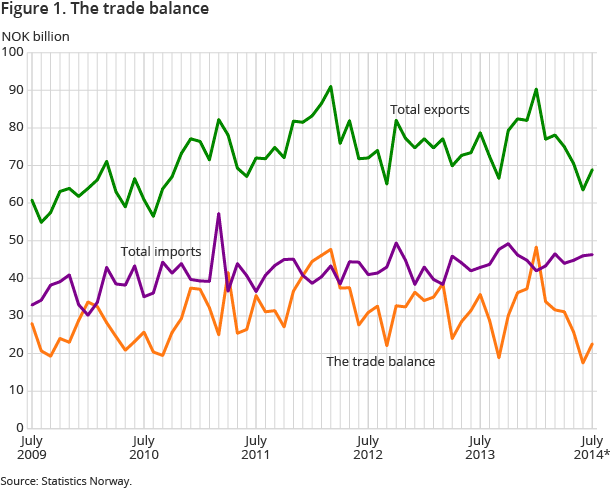
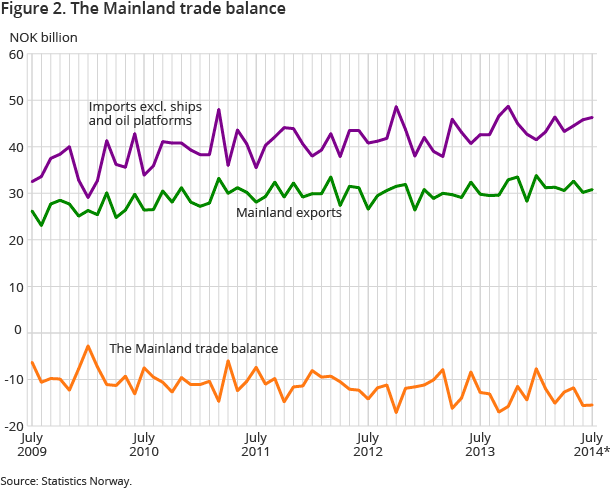
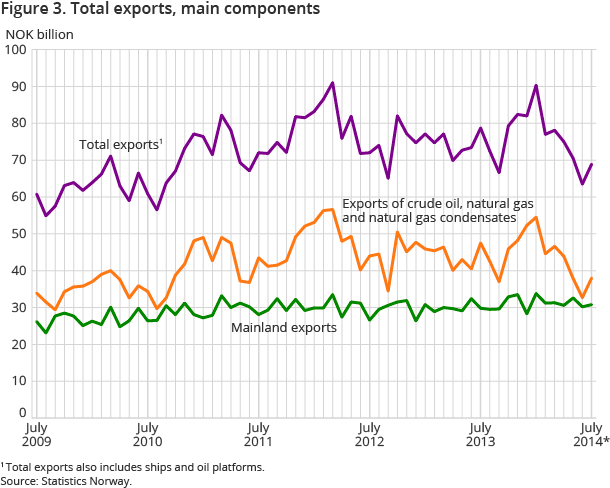
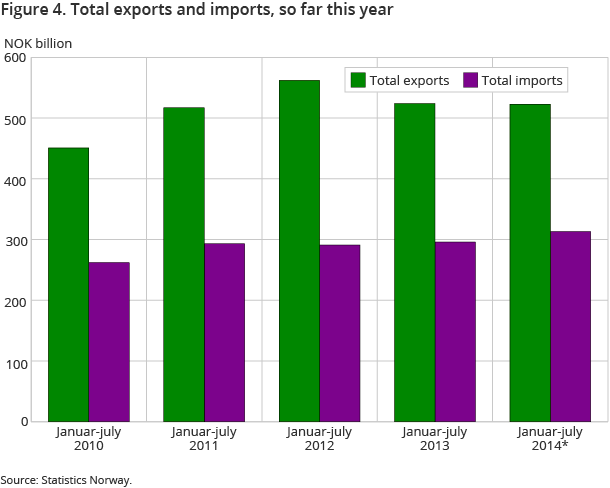
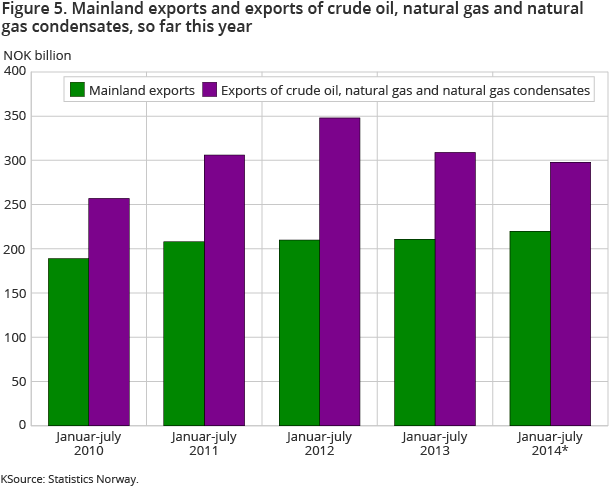
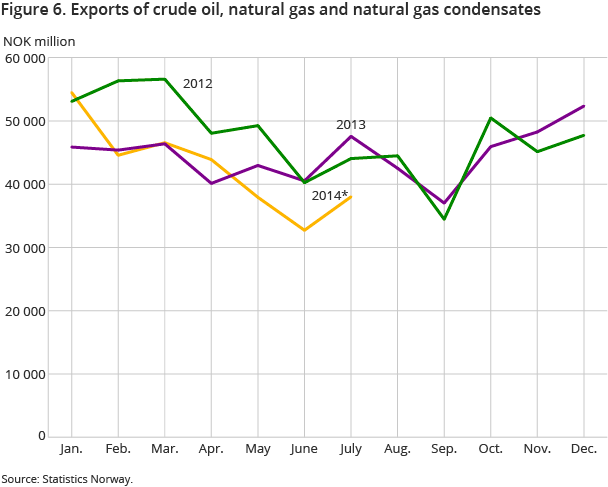
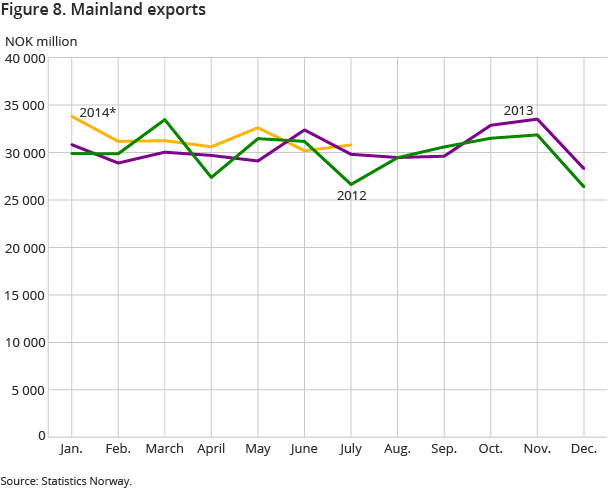
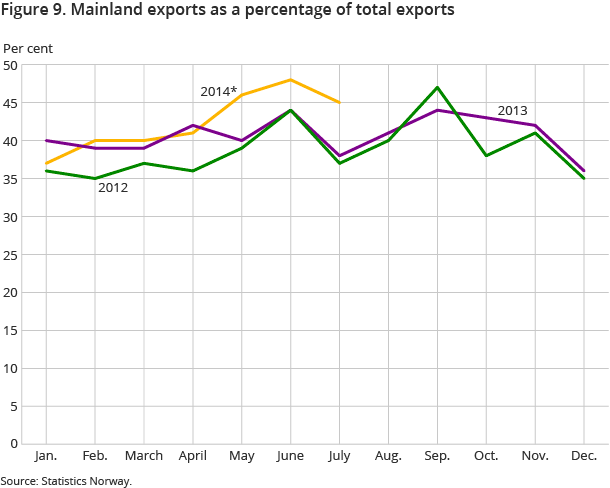
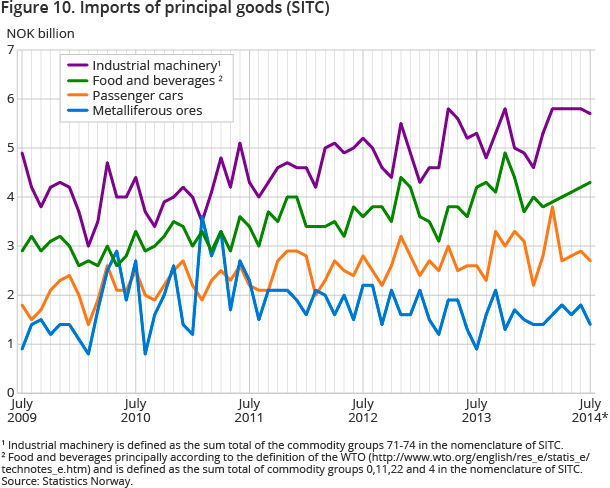
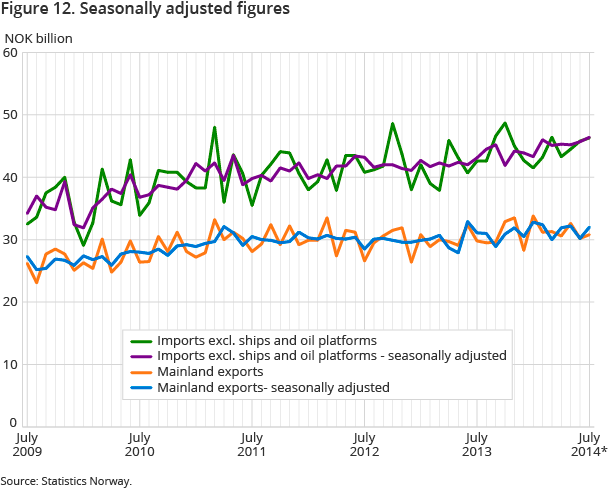
Imports in July rose by 7.8 per cent or NOK 3.4 billion, while exports had a 12.5 per cent decline of NOK 9.2 billion. In particular, exports of shelf commodities, crude oil and natural gas draw the July figures down. Mainland exports increased from July 2013.
Reduced exports of shelf commodities
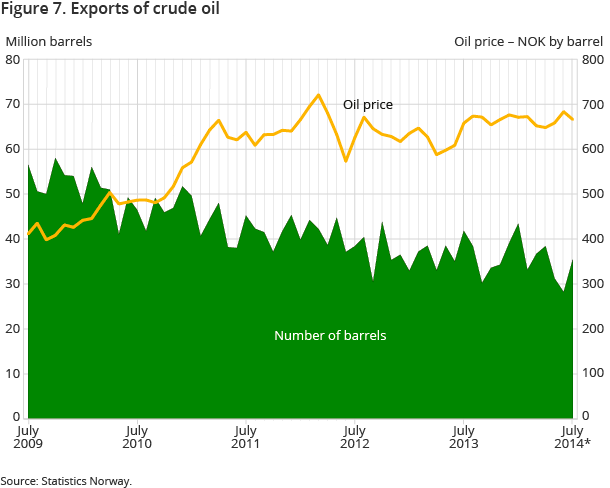
In July, the export value of crude oil was NOK 23.6 billion, down NOK 3.9 billion from July last year. Also, the exported number of barrels was lower. The average price per barrel of crude oil in July was NOK 666. This was NOK 8 more than in July 2013, but NOK 17 lower than the previous month. A stronger dollar helped reduce the drop in value.
Exports of natural gas amounted to NOK 13.8 billion in July this year; 28.4 per cent lower than last July. We exported 7.3 billion standard cubic metres of natural gas. The decline in value was due to lower export volumes combined with significantly reduced prices compared to July 2013.
Greater demand for metals
In July, mainland exports totalled NOK 30.8 billion compared to NOK 29.8 billion in July last year.
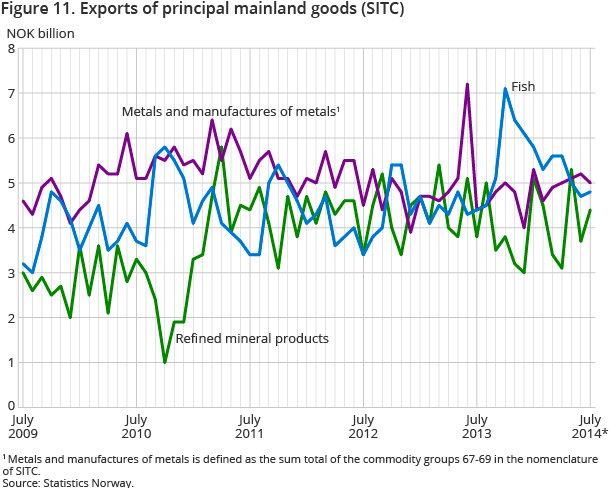
Exports of manufactured goods in July amounted to NOK 5.7 billion, up 10.2 per cent from last July. The total export of metal products alone accounted for almost all of the increase here, with growth of just under NOK 600 million, and the total came to NOK 5.0 billion.
Fish exports climbed in July by NOK 372 million to NOK 4.8 billion. Poland and Russia were the largest importers of Norwegian fish, both with just under half a billion each. Exports of fresh whole salmon to Russia alone amounted to more than NOK 312 million in July. Restrictions on Norwegian fish in Russia will not be reflected in the figures until August.
Considerable machine imports
Imports in July amounted to NOK 46.3 billion; an increase from July last year of NOK 3.4 billion, or 7.8 per cent.
The main commodity group ; machinery and transport equipment came to NOK 18.5 billion in July; NOK 1.6 billion more than last July. Despite a reduction in car imports in July, imports of electric vehicles increased. In fact, we received over 1700 electric vehicles in July - more than three times as many as in July 2013.
Both imports of manufactured goods and miscellaneous manufactured goods showed an increase compared with July last year. The import value amounted to NOK 6.5 and NOK 6.9 billion respectively.
The warm summer is also reflected in the import figures for July, with high imports of, for example, sunglasses, at a value of NOK 24.2 million and over 80 000 more pairs than the same period last year. We also received strawberries for more than NOK 19 million; an increase of NOK 4 million from July 2013. Belgium and the Netherlands are our largest suppliers of strawberries.
Contact
-
Information services external trade
E-mail: utenrikshandel@ssb.no
-
Nina Rolsdorph
E-mail: nina.rolsdorph@ssb.no
tel.: (+47) 41 51 63 78
-
Jan Olav Rørhus
E-mail: jan.rorhus@ssb.no
tel.: (+47) 40 33 92 37
