Content
Published:
This is an archived release.
More goods transported
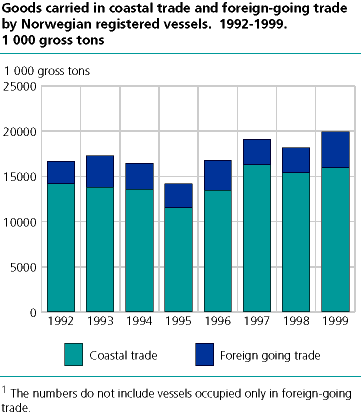
In 1999 Norwegian vessels registered in the NOR (Norwegian Ordinary Ship Register) transported 20 million tons of goods, an increase of 9.9 per cent compared to 1998. Four million tons of goods were transported in foreign-going trade in 1999, an increase of 45.8 per cent from 1998.
The statistics include vessels that transported at least one load between Norwegian ports. They do not include vessels sailing only in foreign-going trade. Eighty per cent, or 16 million tons of goods, were transported in coastal trade by vessels registered in NOR. That is an increase of 3.5 per cent compared to 1998. Dry cargo vessels transported 17.2 million tons of goods in 1999, which comprises 86.4 per cent of total goods transport. Dry cargo vessels between 500 and 3 000 gross tons represent the major increase in the amount of transported goods in foreign-going trade. The amount of foreign-going goods transported by dry cargo vessels between 500 and 3 000 gross tons increased by 1.2 million tons, or 48.2 per cent, to 3.8 million tons. Tankers between 100 and 3 000 gross tons carried 2.7 million tons of freight in 1999, 2.5 million of which were in coastal trade. Tankers in coastal trade transported 0.4 million tons or 14.6 per cent less in 1999 than in 1998.
Three hundred seventy-eight active vessels in 1999
Three hundred seventy-eight vessels were active in goods transport in 1999, a decline of 41 vessels from 1998. At the same time, the gross tonnage of active vessels fell by 8.8 per cent to 295 000 gross tons. The average gross tonnage of active vessels in 1999 was 781 gross tons, compared to 773 gross tons in 1998. Compared to 1998 there were 25 fewer dry cargo vessels this year, 10 of which were in the category dry cargo 500 3 000 gross tons and 12 of which were in the category 200 299 gross tons. Moreover, there were 8 fewer supply vessels, 5 fewer tugboats and 3 fewer tankers. Comparing the change in gross tonnage with the change in number of active vessels in the category dry cargo vessels 500 3 000 gross tons, gross tonnage decreased by 1.5 per cent compared to 1998, while the number of active vessels for the same category fell by 7.0 per cent in the same period. The average gross tonnage for dry cargo vessels between 500 and 3 000 gross tons is thus 1 232 gross tons in 1999, as opposed to 1 163 gross tons in 1998. The average gross tonnage for tankers between 500 and 3 000 tonnes is 753 gross tons in 1999, compared to 734 gross tons in 1998. A corresponding comparison of change in gross tonnage with change in number of active vessels for the category dry cargo vessels 200 299 gross tons shows the gross tonnage was reduced by 25.1 per cent, while the number of active vessels in the same category fell by 22.5 per cent.
Transport type
Vessels for hire is the largest transport type, with 89.7 per cent of coastal goods transport in 1999, a decrease of 2.7 percentage points from 1998. Vessels sailing on own account represent 3.9 per cent of coastal transport, and vessels in regular service represent 6.4 per cent. The share of goods transported by vessels in regular service remained unchanged from 1998, while vessels sailing on own account accounted for 6.6 per cent of coastal transport in 1998.
Tables:
- Table 1 Vessels in coastal trade for hire or reward and on own account. Vessels in operation and gross tonnage, by group of vessel. 1999
- Table 2 Vessels in coastal trade for hire or reward and on own account. Average activity, by group of vessel. 1999. Days
- Table 3 Vessels in coastal trade for hire or reward and on own account. Tonnage carried in coastal trade and foreign-going trade, by group of vessel. 1999. 1 000 gross tons
- Table 4 Vessels in coastal trade for hire or reward and on own account. Tonnage carried in coastal trade by type of freight and, by group of vessel. 1999. 1 000 gross tons
Contact
-
Sjøtransport
E-mail: sjotransport@ssb.no

