Content
Published:
This is an archived release.
Continued increase in turnover
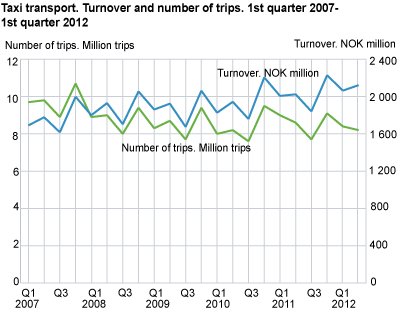
The taxi industry registered a 5 per cent increase in earnings, while the number of trips and occupancy rate per kilometre were reduced during the second quarter of 2012 relative to the same quarter in 2011.
The industry had a turnover of NOK 2.1 billion during the second quarter of 2012; a 5 per cent increase compared to the same quarter a year earlier. The increase can mainly be explained by an increase in taxi fares, which increased by 9 per cent between June 2011 and June 2012.
The total distance covered during the second quarter of 2012 amounted to 142 million kilometres, out of which 56 per cent was covered with passengers in the cab. The industry carried out 8.2 million trips during this period, which was 4 per cent lower than the second quarter of 2011. A combination of an increase in revenue on the one hand and a reduction in number of trips led to turnover per trip of NOK 259; 9 per cent higher than the second quarter of 2011.
Low hourly capacity utilisation
Sixty-one per cent of the time taxis had on offer during the second quarter of 2012 was unutilised. Out of the 8.7 million hours offered in the second quarter of 2012, 3.4 million hours were utilised, which amounts to an hourly capacity utilisation of about 39 per cent.
| Transport activity | 2nd quarter 2012 | 2011 total | Percentage change | ||||||||||||||||||||||||||||||||||||||||||||||||||||||||||||||||||||||||||||
|---|---|---|---|---|---|---|---|---|---|---|---|---|---|---|---|---|---|---|---|---|---|---|---|---|---|---|---|---|---|---|---|---|---|---|---|---|---|---|---|---|---|---|---|---|---|---|---|---|---|---|---|---|---|---|---|---|---|---|---|---|---|---|---|---|---|---|---|---|---|---|---|---|---|---|---|---|---|---|---|
|
2nd quarter 2011-
2nd quarter 2012 |
2010-2011 | ||||||||||||||||||||||||||||||||||||||||||||||||||||||||||||||||||||||||||||||
| Trips (1 000) | 8 204 | 34 441 | -4.2 | 3.4 | |||||||||||||||||||||||||||||||||||||||||||||||||||||||||||||||||||||||||||
| Turnover (NOK million) | 2 122 | 8 101 | 4.9 | 4.7 | |||||||||||||||||||||||||||||||||||||||||||||||||||||||||||||||||||||||||||
| Hours offered (1 000) | 8 745 | 33 859 | 6.2 | 2.4 | |||||||||||||||||||||||||||||||||||||||||||||||||||||||||||||||||||||||||||
| Hours in operation (1 000) | 3 411 | 13 800 | 4.8 | 2.4 | |||||||||||||||||||||||||||||||||||||||||||||||||||||||||||||||||||||||||||
| Total length driven (1 000 km) | 141 479 | 589 226 | -5.8 | 0.8 | |||||||||||||||||||||||||||||||||||||||||||||||||||||||||||||||||||||||||||
| Lenght driven with passengers (1 000 km) | 79 328 | 332 389 | -5.3 | -2.5 | |||||||||||||||||||||||||||||||||||||||||||||||||||||||||||||||||||||||||||
| Turnover per trip (NOK/trip) | 259 | 235 | 9.5 | 1.3 | |||||||||||||||||||||||||||||||||||||||||||||||||||||||||||||||||||||||||||
| Kilometer driven with passenger per trip | 10 | 10 | -1.1 | -5.7 | |||||||||||||||||||||||||||||||||||||||||||||||||||||||||||||||||||||||||||
| Capacity utilization per km driven (per cent) | 56 | 56 | 0.5 | -3.2 | |||||||||||||||||||||||||||||||||||||||||||||||||||||||||||||||||||||||||||
| Capacity utilization per hours offered (per cent) | 39 | 41 | -1.3 | 0.0 | |||||||||||||||||||||||||||||||||||||||||||||||||||||||||||||||||||||||||||
|
The taxi statistics are based on a nationwide survey carried out quarterly on the taxi business classified by code 49.320, Taxi Operation in SIC07. The survey covers over 90 per cent of the taxi population in Norway. The data is then scaled up to population total based on VAT from the Directorate of Taxes. |
New estimation methodIn the first quarter of 2012, Statistics Norway adopted a new method for predicting population totals for taxis. This can result in minor breaks in the series. For more information, please refer to “ About the statistics ” at the left hand side of this page. |
Tables:
This page has been discontinued, see Taxi transport, Annually.
Contact
-
Geir Martin Pilskog
E-mail: geir.martin.pilskog@ssb.no
tel.: (+47) 40 81 13 83

