Content
Published:
Taxi industry rolls on
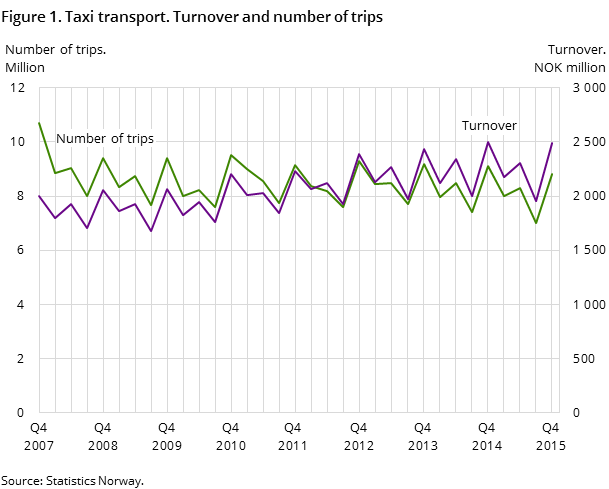
In 2015, the number of trips and kilometres driven with passengers was stable. During the same period, revenue increased 1.3 per cent to NOK 8.9 billion.
| 4th quarter 2015 | 2015 | Change in per cent | ||
|---|---|---|---|---|
| 4th quarter 2014 - 4th quarter 2015 | 2014 - 2015 | |||
| Trips (1 000) | 8 823 | 32 180 | -2.6 | -0.4 |
| Turnover (NOK million) | 2 489 | 8 924 | -0.4 | 1.3 |
| Hours offered (1 000) | 8 586 | 32 423 | -2.6 | -1.1 |
| Hours in operation (1 000) | 2 734 | 10 163 | -5.3 | -2.1 |
| Total length driven (1 000 km) | 158 513 | 574 499 | -1.1 | -0.3 |
| Lenght driven with passengers (1 000 km) | 84 498 | 309 405 | -2.2 | 0.1 |
| Turnover per trip (NOK/trip) | 282.1 | 277.3 | 2.2 | 1.8 |
| Kilometer driven with passenger per trip | 9.6 | 9.6 | 1.1 | 0.5 |
| Capacity utilization per km driven (per cent) | 53.3 | 53.9 | -1.1 | 0.6 |
| Capacity utilization per hours offered (per cent) | 31.8 | 31.3 | -2.8 | -0.9 |

In 2015, the turnover per trip was NOK 277, which represents an increase of 1.8 per cent compared to 2014. Figures from the national taxi owner association show that taxi fares increased by 1.8 per cent from 2014 to 2015.
More passenger kilometres and fewer trips
The taxis’ total mileage was 574 million kilometres, which is 0.3 per cent less than in 2014. A total of 53.9 per cent of all mileage was carried out with passengers in the car, equivalent to 309 million kilometres. This was 0.1 per cent higher than in 2014. A total of 32.2 million taxi trips were carried out in 2015; a decrease of 0.4 per cent compared to 2014. An average trip with passengers was 9.6 kilometres.
Slowing down of industry in 4th quarter
Compared to the 4th quarter of 2014, the number of trips decreased 2.6 per cent to 8.8 million trips. Kilometres driven with passengers decreased 2.2 per cent and turnover fell 0.4 per cent to NOK 2.5 billion in the period. From the 4th quarter of 2014, revenue per trip increased by 2.2 per cent to NOK 282.
This page has been discontinued, see Taxi transport, Annually.
Contact
-
Geir Martin Pilskog
E-mail: geir.martin.pilskog@ssb.no
tel.: (+47) 40 81 13 83
