Content
Published:
This is an archived release.
Slowdown in transport activities
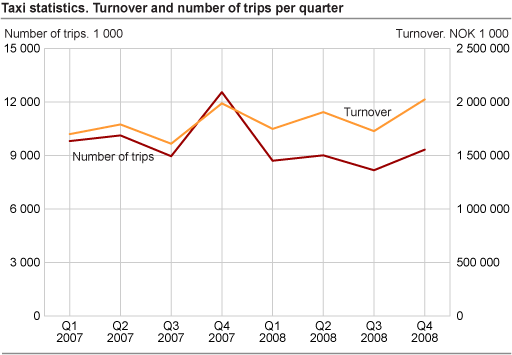
The number of taxi trips declined by 9.5 per cent, to 35 million trips from 2007 to 2008. Turnover per trip, on the other hand, increased from NOK 182 to NOK 212 such that the total industry turnover grew by 5.7 per cent to NOK 7.5 billion from 2007.
The statistics for taxi business are being published for the first time with data obtained from a quarterly survey going back to the 1s t quarter of 2007.
A total of 35 million trips were made in 2008, which corresponds to 7.4 taxi trips per capita compared to 8.2 in 2007. The taxi industry covered a distance of 639 million kilometres in 2008; a reduction of 4.9 per cent from the preceding year. Out of this, 397 million kilometres were driven with passengers on board. Consequently, the average taxi trip per passenger was about 11.3 kilometres in 2008 compared to 10.7 kilometres in 2007.
An average taxi trip took 28 minutes in 2008 compared with 25 minutes in 2007. Capacity utilisation, measured as a share of kilometres driven with passengers to total kilometres driven, was 62.1 per cent. Capacity utilisation measured as a share of taxi hours on offer, however, was 44.5 per cent. In other words, an average taxi is occupied for 62.1 per cent of the distance covered or 44.5 per cent of the time it is in operation.
Highest number of trips in Oslo but longest trips in Finnmark
On average, a typical Oslo resident took 16 taxi trips in 2008, while the national average was about 7.4. In Finnmark, on the other hand, the average trip had a length of about 19 kilometres, compared to a national average of 11.3 kilometres.
Turnover per trip was highest in Akershus and Oslo, with NOK 329 and NOK 311 respectively. These two counties accounted for over 30 per cent of the industry’s total turnover and transport activity.
A decline in 4t h quarter
Despite the fact that the 4t h quarter is the peak season in the taxi industry, transport activity fell significantly in the 4t h quarter of 2008 compared to the corresponding quarter in 2007. The number of trips declined by 11.9 per cent, while kilometres with passengers, total kilometres driven, hours offered, and hours in operation dropped by 16.6, 11.1, 5.8, and 5.2 per cent respectively. However turnover increased slightly from NOK 7 084 million to NOK 7 490 million in 2008.
|
The taxi statistics are based on a nationwide survey carried out quarterly on the taxi business classified by code 49.320, Taxi Operation in SN07. The survey covers over 90 per cent of the taxi population in the country. The data is then scaled up to population size using a factor. This factor is calculated based on data from the survey and VAT data reported to the Directorate of Taxes. |
Tables:
This page has been discontinued, see Taxi transport, Annually.
Contact
-
Geir Martin Pilskog
E-mail: geir.martin.pilskog@ssb.no
tel.: (+47) 40 81 13 83

