Content
Published:
This is an archived release.
Higher turnover for waste collection
Enterprises within water supply, sewerage and waste had a total turnover of NOK 21.8 billion in 2010, which corresponds to an increase of 19 per cent compared with 2009.
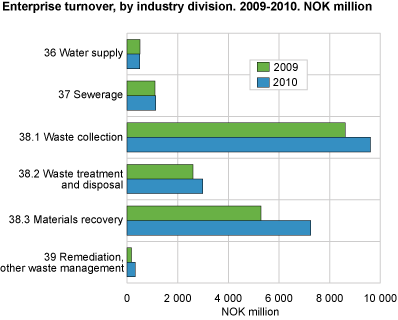
Waste activities and materials recovery was the largest industry, which with a turnover of NOK 19.9 billion made up over 91 per cent of the total turnover.
Turnover within waste activities and materials recovery consists of NOK 9.6 billion from waste collection, NOK 7.2 billion from materials recovery and NOK 2.9 billion from waste treatment and disposal. Materials recovery experienced the largest increase in turnover by nearly NOK 2 billion, or over 37 per cent compared to 2009. This can partly be explained by an increase in metal prices.
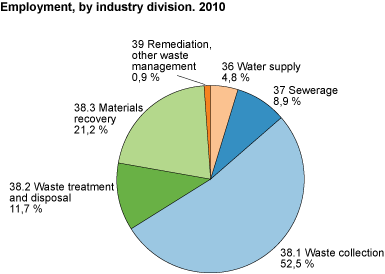
Highest employment in waste activities and materials recovery
The number of persons employed within water supply, sewerage and waste in 2010 was 8 553, up 5 per cent compared to 2009. Eighty-five per cent of these were employed within waste activities and materials recovery. Of these, 4 488 worked with waste collection, 1 815 with materials recovery and 999 with waste treatment and disposal.
Preliminary figuresPreliminary figures for structural business statistics are only published for enterprises and with fewer variables than for final figures. Final figures are published within 18 months after the end of the reference period. |
Tables:
The statistics is now published as Business statistics.
Contact
-
Statistics Norway's Information Centre
E-mail: informasjon@ssb.no
tel.: (+47) 21 09 46 42