
Statistikk innhold
Statistics on
External trade in goods
The external trade statistics comprise the development in Norway's trade with other countries in terms of value and volume figures. Aggregated as well as detailed imports and exports figures between Norway and partner countries, trade regions and continents are provided.
Selected figures from these statistics
- External trade in goods. Month and so far this yearDownload table as ...External trade in goods. Month and so far this year1
NOK Billion Change in per cent NOK Billion - so far this year Change in per cent - so far this year September 2026 August 2026 - September 2026 September 2025 - September 2026 September 2026 September 2025 - September 2026 Exports 207.7 8.8 53.3 1 560.9 15.8 Crude oil 56.3 32.1 60.6 418.9 26.1 Natural gas 79.4 2.1 135.6 541.7 22.2 Ships and oil platforms 0.0 -75.0 . 0.9 332.4 Mainland exports 70.9 0.4 7.4 594.7 4.5 Fish, crustaceans, molluscs and prep. thereof 17.0 12.3 0.0 127.4 1.7 Imports 102.7 13.6 6.2 847.0 3.4 Ships and oil platforms 0.0 -100.0 . 0.4 -71.9 The trade balance 105.0 4.4 170.5 713.9 35.1 The mainland trade balance -31.8 -60.9 -3.6 -252.0 -1.3 1Due to the data collection method, the preliminary monthly figures published for ships and oil platforms are often incomplete. In retrospect, therefore, the trade in these goods could in some cases lead to major corrections in the figures. Explanation of symbolsDownload table as ... - Imports of goods, main groups by SITC. Month and so far this yearDownload table as ...Imports of goods, main groups by SITC. Month and so far this year1
NOK Million Change in per cent NOK Million Change in per cent September 2025 September 2026 September 2025 -September 2026 So far this year September 2025 -September 2026 September 2025 September 2026 Total 96 698 102 681 6.2 819 166 847 003 3.4 Of which: Ships and oil platforms (part of SITC 793) 0 0 . 1 317 371 -71.8 Imports excl. Ships and oil platforms 96 698 102 681 6.2 817 849 846 633 3.5 0 Food and live animals 7 517 7 274 -3.2 65 039 62 644 -3.7 00 Live animals other than animals of div.03 20 26 32.0 206 252 22.2 01 Meat and meat preparations 256 232 -9.4 1 924 2 818 46.5 02 Dairy products and birds' eggs 255 240 -6.2 2 166 2 164 -0.1 03 Fish, crustaceans, molluscs and prep. thereof 589 810 37.5 5 505 5 987 8.8 04 Cereals and cereal preparations 849 802 -5.5 7 668 7 038 -8.2 05 Vegetables and fruit 1 410 1 269 -10.0 15 272 14 694 -3.8 06 Sugars, sugar prepatations and honey 284 260 -8.7 2 289 2 071 -9.5 07 Coffee, tea, cocoa, spices 1 021 873 -14.5 8 434 6 462 -23.4 08 Feeding stuff for animals (not cereals) 1 954 1 880 -3.8 14 515 14 182 -2.3 09 Miscellaneous edible products 878 883 0.5 7 059 6 976 -1.2 1 Beverages and tobacco 1 301 1 232 -5.3 11 815 11 264 -4.7 11 Beverages 823 805 -2.1 7 977 7 701 -3.5 12 Tobacco and tobacco manufactures 478 427 -10.7 3 838 3 563 -7.2 2 Crude materials, inedible, except fuels 5 711 5 725 0.2 50 018 50 796 1.6 21 Hides, skins and furskins, raw 5 4 -15.9 34 34 0.7 22 Oil seeds and oleaginous fruits 269 61 -77.4 2 266 1 940 -14.4 23 Crude rubber 15 25 63.6 170 170 -0.2 24 Wood, lumber and cork 484 458 -5.5 4 531 4 095 -9.6 25 Pulp and waste paper 31 13 -57.2 468 343 -26.7 26 Textile fibres and their waste 21 23 10.0 139 139 0.0 27 Crude fertilizers and crude minerales 595 650 9.2 5 250 5 414 3.1 28 Metalliferous ores and metal scrap 3 901 4 180 7.2 33 794 35 334 4.6 29 Crude animal and vegetable materials 390 311 -20.3 3 364 3 326 -1.1 3 Mineral fuels, lubricants and related materials 5 503 9 584 74.2 44 258 61 678 39.4 32 Coal, coke and briquettes 273 253 -7.4 2 957 2 359 -20.2 33 Petroleum, petroleum products 4 698 8 178 74.1 36 446 45 850 25.8 334 Petroleum oils and oils obtained from bituminous minerals (other than crude); preparations, n.e.s., containing by weight 70% or more of petroleum oils or of oils obtained from bituminous minerals, these oils being the basic constituents of the preparation 2 884 6 185 114.4 26 730 35 691 33.5 34 Gas , natural and manufactured 211 145 -31.3 1 774 1 541 -13.2 342 Liquefied propane and butane 139 62 -55.4 1 320 949 -28.1 35 Electric current 321 1 009 214.7 3 080 11 928 287.2 4 Animal and vegetable oils, fats and waxes 1 594 1 725 8.2 12 220 12 932 5.8 41 Animal oils and fats 854 720 -15.7 5 082 4 696 -7.6 42 Fixed vegetable fats and oils, crude, refined or fractionated 687 868 26.5 6 103 7 022 15.0 43 Animal or vegetable fats and oils, processed 54 137 155.6 1 034 1 214 17.4 5 Chemicals and related products n.e.s. 10 771 10 746 -0.2 88 746 92 144 3.8 51 Organic chemicals 1 085 1 137 4.7 9 194 9 298 1.1 52 Inorganic chemicals 910 886 -2.7 8 338 8 717 4.5 53 Dyeing, tanning and colouring materials 455 446 -2.0 3 824 3 846 0.6 54 Medicinal and pharmaceutical products 3 466 3 227 -6.9 26 790 27 125 1.2 55 Essential oils and resinoids etc 1 340 1 265 -5.6 11 097 10 942 -1.4 56 Fertilizers 568 466 -17.9 4 393 4 792 9.1 57 Plastics in primary forms 585 630 7.7 5 061 5 161 2.0 58 Plastics in non-primary forms 836 835 -0.2 7 065 7 095 0.4 59 Chemical materials and products, n.e.s. 1 525 1 854 21.6 12 985 15 169 16.8 6 Manufactured goods classified chiefly by material 13 784 11 812 -14.3 108 525 98 505 -9.2 61 Leather, leather manufactures, furskins 33 45 34.3 283 313 10.4 62 Rubber manufactures, n.e.s. 873 907 3.9 6 594 6 654 0.9 63 Cork and wood manufactures 808 870 7.7 6 830 6 833 0.0 64 Paper, paperboard and manufactures thereof 929 938 0.9 7 863 7 661 -2.6 65 Textile yarn, fabrics, made-up articles 977 959 -1.9 8 852 8 255 -6.7 66 Non-metallic mineral manufactures, n.e.s. 1 185 1 142 -3.6 9 545 8 973 -6.0 67 Iron and steel 2 630 1 966 -25.3 20 762 15 978 -23.0 68 Non-ferrous metals 1 071 1 105 3.2 10 220 11 540 12.9 69 Manufactures of metals, n.e.s. 5 276 3 880 -26.5 37 574 32 298 -14.0 7 Machinery and transport equipment 34 607 39 318 13.6 308 286 328 439 6.5 71 Power generating machinery and equipment 1 484 1 706 14.9 15 515 17 424 12.3 72 Machinery for special industries 2 993 2 816 -5.9 27 467 27 338 -0.5 73 Metal working machinery 278 256 -7.7 2 465 2 513 2.0 74 General industrial machinery and equipment 5 925 5 737 -3.2 48 989 48 827 -0.3 75 Office machines, data processing machines 4 591 6 039 31.5 31 010 43 726 41.0 76 Telecommunications apparatus and equipment 3 203 3 359 4.9 27 851 29 182 4.8 77 Electrical machinery and apparatus 6 231 6 755 8.4 52 137 54 693 4.9 78 Road vehicles 8 790 11 202 27.4 84 444 91 678 8.6 781 Motor cars and other motor vehicles principally designed for the transport of persons 5 322 7 512 41.2 49 021 55 798 13.8 79 Other transport equipment including ships 1 112 1 448 30.2 18 408 13 059 -29.1 8 Miscellaneous manufactured articles 13 019 13 395 2.9 106 817 105 720 -1.0 81 Prefabricated buildings 991 868 -12.4 7 674 6 807 -11.3 82 Furniture and parts thereof 1 683 1 680 -0.2 14 905 14 364 -3.6 83 Travel goods, handbags etc. 236 262 11.2 2 257 2 034 -9.8 84 Articles of apparel and accessories 2 820 2 639 -6.4 20 441 19 593 -4.1 85 Footwear 737 624 -15.3 5 608 5 113 -8.8 87 Professional and scientific instruments 2 276 2 322 2.0 20 533 20 186 -1.7 88 Photographic and optical goods 444 453 2.0 3 910 4 059 3.8 89 Miscellaneous manufactured articles, n.e.s 3 832 4 546 18.6 31 490 33 563 6.6 9 Other commodities and transactions 2 892 1 870 -35.4 23 444 22 883 -2.4 91 Postal packages not classified according to kind 0 0 . 0 0 . 93 Special transactions and commodities not classified according to kind 2 717 1 708 -37.1 22 031 21 003 -4.7 96 Coin (other than gold coin), not being legal tender 2 3 59.0 37 64 72.0 97 Gold, non-monetary (excluding gold, ores and concentrates) 173 158 -8.5 1 376 1 816 32.0 1Standard International Trade Classification, Revision 4 (SITC, Rev. 4) Explanation of symbolsDownload table as ... - Exports of goods, main groups by SITC. Month and so far this yearDownload table as ...Exports of goods, main groups by SITC. Month and so far this year1
NOK Million Change in per cent NOK Million Change in per cent September 2025 September 2026 September 2025 -September 2026 So far this year September 2025 -September 2026 September 2025 September 2026 Total 135 527 207 709 53.3 1 347 566 1 560 887 15.8 Of which: Crude oil (part of SITC 333) 35 064 56 312 60.6 332 218 418 944 26.1 Natural gas (SITC 343) 33 702 79 396 135.6 443 332 541 745 22.2 Natural gas condensates (part of SITC 333) 738 1 088 47.4 2 738 4 572 67.0 Ships and oil platforms (part of SITC 793) 0 2 . 219 948 332.9 Mainland exports 66 023 70 912 7.4 569 059 594 678 4.5 0 Food and live animals 18 385 18 284 -0.5 135 411 137 510 1.6 00 Live animals other than animals of div.03 6 10 65.7 70 65 -7.6 01 Meat and meat preparations 55 48 -12.0 431 422 -2.1 02 Dairy products and birds' eggs 83 66 -20.9 557 532 -4.4 03 Fish, crustaceans, molluscs and prep. thereof 16 982 16 990 0.0 125 187 127 358 1.7 04 Cereals and cereal preparations 84 80 -3.7 737 741 0.5 05 Vegetables and fruit 28 32 16.7 211 241 14.0 06 Sugars, sugar prepatations and honey 7 6 -20.0 57 51 -9.5 07 Coffee, tea, cocoa, spices 81 71 -12.1 640 548 -14.3 08 Feeding stuff for animals (not cereals) 699 665 -4.8 4 600 4 937 7.3 09 Miscellaneous edible products 361 316 -12.5 2 922 2 617 -10.5 1 Beverages and tobacco 130 97 -25.6 1 041 912 -12.4 11 Beverages 124 92 -26.0 982 859 -12.6 12 Tobacco and tobacco manufactures 5 4 -17.7 59 54 -8.6 2 Crude materials, inedible, except fuels 2 572 2 928 13.8 23 824 24 443 2.6 21 Hides, skins and furskins, raw 27 29 5.5 184 174 -5.3 22 Oil seeds and oleaginous fruits 4 1 -86.1 11 4 -59.1 23 Crude rubber 6 7 14.2 54 39 -27.6 24 Wood, lumber and cork 864 742 -14.1 7 001 7 075 1.1 25 Pulp and waste paper 295 300 1.4 3 163 3 046 -3.7 26 Textile fibres and their waste 28 30 8.2 252 222 -11.7 27 Crude fertilizers and crude minerales 505 689 36.4 4 323 4 297 -0.6 28 Metalliferous ores and metal scrap 799 1 096 37.3 8 011 9 044 12.9 29 Crude animal and vegetable materials 44 35 -20.7 825 542 -34.4 3 Mineral fuels, lubricants and related materials 75 886 148 158 95.2 852 372 1 056 651 24.0 32 Coal, coke and briquettes 0 1 201.8 55 15 -72.2 33 Petroleum, petroleum products 39 324 64 217 63.3 376 000 478 204 27.2 334 Petroleum oils and oils obtained from bituminous minerals (other than crude); preparations, n.e.s., containing by weight 70% or more of petroleum oils or of oils obtained from bituminous minerals, these oils being the basic constituents of the preparation 3 491 6 769 93.9 40 631 54 218 33.4 34 Gas , natural and manufactured 34 658 81 455 135.0 457 247 557 154 21.8 342 Liquefied propane and butane 852 1 929 126.4 12 679 14 178 11.8 35 Electric current 1 904 2 486 30.5 19 069 21 278 11.6 4 Animal and vegetable oils, fats and waxes 565 681 20.5 4 121 4 663 13.1 41 Animal oils and fats 257 317 23.6 1 822 2 197 20.6 42 Fixed vegetable fats and oils, crude, refined or fractionated 54 132 143.8 639 693 8.3 43 Animal or vegetable fats and oils, processed 255 233 -8.7 1 660 1 773 6.9 5 Chemicals and related products n.e.s. 6 769 6 934 2.4 63 710 63 857 0.2 51 Organic chemicals 1 356 1 499 10.6 13 686 14 257 4.2 52 Inorganic chemicals 950 874 -8.0 9 286 8 333 -10.3 53 Dyeing, tanning and colouring materials 214 226 5.6 1 940 2 018 4.0 54 Medicinal and pharmaceutical products 1 098 1 041 -5.2 9 924 9 549 -3.8 55 Essential oils and resinoids etc 260 281 8.1 2 414 2 312 -4.2 56 Fertilizers2 : : : : : : 57 Plastics in primary forms 679 703 3.5 6 277 6 410 2.1 58 Plastics in non-primary forms 193 222 14.8 1 725 1 739 0.8 59 Chemical materials and products, n.e.s. 2 018 2 088 3.4 18 458 19 237 4.2 6 Manufactured goods classified chiefly by material 14 368 12 124 -15.6 100 956 105 326 4.3 61 Leather, leather manufactures, furskins 8 7 -12.6 78 55 -28.9 62 Rubber manufactures, n.e.s. 146 143 -1.8 1 029 1 085 5.5 63 Cork and wood manufactures 257 233 -9.6 2 052 2 045 -0.3 64 Paper, paperboard and manufactures thereof 578 495 -14.4 5 316 4 782 -10.1 65 Textile yarn, fabrics, made-up articles 256 248 -3.5 2 065 2 061 -0.2 66 Non-metallic mineral manufactures, n.e.s. 262 264 0.7 2 252 1 969 -12.6 67 Iron and steel 2 067 1 270 -38.5 14 628 12 765 -12.7 68 Non-ferrous metals 7 154 8 180 14.3 62 121 71 956 15.8 69 Manufactures of metals, n.e.s. 3 639 1 285 -64.7 11 415 8 609 -24.6 7 Machinery and transport equipment 11 936 13 112 9.9 125 151 121 153 -3.2 71 Power generating machinery and equipment 1 266 1 608 27.0 10 493 10 683 1.8 72 Machinery for special industries 1 401 1 415 1.0 11 880 12 776 7.5 73 Metal working machinery 91 124 36.5 694 654 -5.8 74 General industrial machinery and equipment 3 002 3 475 15.7 23 655 26 617 12.5 75 Office machines, data processing machines 731 711 -2.8 3 865 4 711 21.9 76 Telecommunications apparatus and equipment 1 002 1 304 30.1 9 296 10 520 13.2 77 Electrical machinery and apparatus 2 390 2 409 0.8 39 716 33 769 -15.0 78 Road vehicles 1 324 1 409 6.4 12 186 10 999 -9.7 79 Other transport equipment including ships 728 656 -9.8 13 364 10 424 -22.0 8 Miscellaneous manufactured articles 4 485 4 869 8.6 37 579 41 058 9.3 81 Prefabricated buildings 260 244 -6.1 1 922 2 002 4.2 82 Furniture and parts thereof 334 352 5.4 2 699 2 650 -1.8 83 Travel goods, handbags etc. 29 30 0.7 227 249 9.7 84 Articles of apparel and accessories 312 327 4.9 2 202 2 271 3.2 85 Footwear 82 94 13.9 672 766 14.0 87 Professional and scientific instruments 1 790 1 848 3.3 15 847 16 576 4.6 88 Photographic and optical goods 42 36 -14.5 345 355 2.7 89 Miscellaneous manufactured articles, n.e.s 1 635 1 937 18.5 13 665 16 189 18.5 9 Other commodities and transactions 430 521 21.2 3 401 5 314 56.3 91 Postal packages not classified according to kind 0 0 . 0 0 . 93 Special transactions and commodities not classified according to kind 70 90 29.5 518 629 21.4 96 Coin (other than gold coin), not being legal tender 0 1 1 421.2 6 6 -3.0 97 Gold, non-monetary (excluding gold, ores and concentrates) 360 430 19.4 2 876 4 679 62.7 1Standard International Trade Classification, Revision 4 (SITC, Rev. 4) 2Due to confidentiality in commodity group 56, this group can not be published separately. This group is included in group 59. Explanation of symbolsDownload table as ... - Mainland exports by county of production, commodity groups by the SITC. Year. NOK millionDownload table as ...Mainland exports by county of production, commodity groups by the SITC. Year. NOK million1 2
2025 Total mainland exports Distribution by the SITC Food, beverages and tobacco (SITC 0 and 1) Fish (subgroup 03 of SITC 0) Crude materials except fuels (SITC 2 and 4) Fuels (SITC 3) Chemicals and related products n.e.s (SITC 5) Manufactured goods (SITC 6) Machinery and transport equipment (SITC 7) Miscellanous manufactured articles (SITC 8) The whole country 768 063 188 963 173 911 37 610 96 923 84 110 131 412 177 159 51 887 County of production Oslo - Oslove 21 735 1 502 229 2 114 5 9 901 988 5 730 1 496 Østfold 20 855 1 497 137 4 049 52 7 888 3 802 3 428 140 Akershus 10 684 1 391 554 274 21 5 091 245 2 330 1 332 Buskerud 19 343 54 1 505 47 1 108 2 316 8 283 7 029 Vestfold 13 481 110 28 1 149 19 2 137 5 158 3 118 1 791 Telemark 35 410 424 185 502 480 26 215 2 666 4 216 907 Innlandet 20 169 917 579 2 955 21 753 2 400 6 717 6 406 Agder 46 282 883 752 859 6 8 873 28 952 6 326 383 Rogaland 57 183 10 298 7 527 3 510 16 593 1 357 13 409 10 007 2 010 Vestland 138 234 35 137 33 372 3 483 51 478 2 834 24 731 19 109 1 462 Møre og Romsdal 69 982 35 494 33 477 2 925 2 3 572 13 593 12 307 2 090 Trøndelag - Trööndelage 45 990 27 603 26 782 1 376 34 4 946 6 374 3 522 2 135 Troms - Romsa - Tromssa 21 350 19 997 19 916 142 0 : : 70 9 Finnmark - Finnmárku - Finmarkku 9 447 8 307 8 304 514 556 2 : 24 : Nordland - Nordlánnda 50 632 30 838 30 314 2 247 0 : 11 474 : 65 Svalbard 76 0 0 0 76 0 0 0 0 Jan Mayen 0 0 0 0 0 0 0 0 0 Norwegian goods produced in several counties 46 584 9 340 8 641 9 175 26 613 313 119 556 468 Re-exports of goods produced abroad3 118 025 2 959 1 677 823 907 4 226 11 265 78 223 19 622 County not stated4 22 599 2 213 1 436 1 007 11 1 376 2 805 10 673 4 514 1 2Standard International Trade Classification, Revision 4 (SITC, Rev. 4 3County of production is defined as the county for the major value added. When the exports consists of a mix of goods from different counties, and the county of production is hard to state, the definition Norwegian goods produced in several counties is used. In the case when the value of an imported intermediate good is more than doubled, the good is considered as produced in Norway. In the opposite it is considered as exports of goods produced abroad. 4County not stated implies no information about county of production is available. 12 July 2024: Table 10482 in StatBank has been updated with new figures for the years 2022 and 2023. Explanation of symbolsDownload table as ... - Imports and exports of goods, by trade areas, continents and selected countries. Year. NOK MillionDownload table as ...Imports and exports of goods, by trade areas, continents and selected countries. Year. NOK Million
2025 Exports Imports Trade balance Total 1 778 791 1 117 938 660 852 Trade areas Nordic countries 287 430 187 803 99 627 EFTA 17 101 14 761 2 340 EU1 1 175 368 612 896 562 472 OECD 1 508 846 671 267 837 579 Developing countries 128 314 252 169 -123 854 LDC - least developed countries 5 405 7 042 -1 637 Continents and countries Europe 1 532 399 693 248 839 151 Belgium 90 115 22 494 67 621 Denmark 100 677 46 642 54 035 Estonia 3 393 6 967 -3 574 Finland 58 281 25 609 32 672 France 102 439 32 399 70 040 Greece 7 926 1 853 6 073 Ireland 7 548 13 745 -6 197 Iceland 10 286 3 274 7 012 Italy 31 717 38 151 -6 434 Lithuania 15 938 12 671 3 268 Netherlands 173 056 45 807 127 249 Poland 104 572 43 911 60 660 Portugal 8 209 4 227 3 982 Romania 6 517 9 130 -2 613 Russia 521 2 767 -2 246 Slovakia 1 345 4 808 -3 463 Spain 21 622 21 185 437 United Kingdom 316 579 45 823 270 755 Switzerland 6 811 11 418 -4 606 Sweden 114 952 110 997 3 955 Czechia 3 916 15 169 -11 253 Türkiye 10 132 10 718 -585 Germany 310 141 130 630 179 512 Hungary 1 707 7 999 -6 292 Austria 4 311 7 031 -2 721 Other countries in Europe 19 688 17 823 1 865 Asia 125 947 233 878 -107 931 Hong Kong 2 300 2 383 -82 India 4 258 9 696 -5 438 Japan 10 665 18 545 -7 880 China 48 733 133 302 -84 568 Malaysia 3 118 5 096 -1 977 Singapore 5 333 4 542 792 South Korea 16 765 10 157 6 609 Taiwan 2 522 7 769 -5 248 Thailand 5 763 8 335 -2 572 Viet Nam 5 556 13 538 -7 982 Other countries in Asia 20 934 20 515 419 Northern, Central America and the Caribbean 84 528 106 600 -22 072 Canada 8 888 18 551 -9 663 United States of America 68 279 79 160 -10 881 Other countries in North- and Central America 7 361 8 889 -1 528 South America 13 975 36 631 -22 656 Brazil 9 794 22 956 -13 162 Chile 1 716 4 880 -3 164 Peru 391 4 230 -3 839 Other countries in South-America 2 074 4 565 -2 491 Africa 17 102 14 947 2 156 Angola 2 327 58 2 269 Botswana 1 137 -137 South Africa 1 115 4 848 -3 734 Other countries in Africa 13 659 9 904 3 758 Oceania 4 138 2 761 1 377 Australia 3 521 2 189 1 332 New Zealand 447 567 -121 Other countries in Oceania 170 5 165 1Figures for EU is without Great Britain from February 2020 on. Explanation of symbolsDownload table as ... - Imports and exports of goods (imports excl. ships and oil platforms and mainland exports), by trade areas, continents and selected countries. Year. NOK MillionDownload table as ...Imports and exports of goods (imports excl. ships and oil platforms and mainland exports), by trade areas, continents and selected countries. Year. NOK Million
2025 Mainland exports Imports excluding ships and oil platforms Trade balance Total 768 063 1 115 801 -347 737 Trade areas Nordic countries 140 154 187 580 -47 426 EFTA 17 101 14 752 2 349 EU1 425 139 612 472 -187 333 OECD 518 386 671 005 -152 619 Developing countries 115 431 251 372 -135 941 LDC - least developed countries 3 710 7 042 -3 332 Continents and countries Europe 538 332 692 816 -154 484 Belgium 20 908 22 494 -1 586 Denmark 45 622 46 478 -856 Estonia 3 393 6 967 -3 574 Finland 11 705 25 564 -13 859 France 20 664 32 399 -11 735 Greece 2 304 1 853 451 Ireland 7 548 13 745 -6 197 Iceland 10 286 3 265 7 021 Italy 20 764 38 151 -17 386 Lithuania 7 306 12 671 -5 365 Netherlands 62 046 45 807 16 238 Poland 38 153 43 882 -5 729 Portugal 8 209 4 218 3 991 Romania 4 358 9 130 -4 772 Russia 521 2 767 -2 246 Slovakia 1 345 4 808 -3 463 Spain 20 308 21 185 -877 United Kingdom 75 848 45 823 30 025 Switzerland 6 811 11 418 -4 606 Sweden 69 306 110 991 -41 684 Czechia 3 916 15 169 -11 253 Türkiye 7 024 10 718 -3 693 Germany 65 729 130 630 -64 901 Hungary 1 707 7 999 -6 292 Austria 4 311 7 031 -2 721 Other countries in Europe 18 240 17 653 587 Asia 112 513 233 081 -120 568 Hong Kong 2 300 2 383 -82 India 4 258 9 696 -5 438 Japan 10 665 18 545 -7 880 China 42 443 132 505 -90 062 Malaysia 3 118 5 096 -1 977 Singapore 4 818 4 542 277 South Korea 13 317 10 157 3 160 Taiwan 2 522 7 769 -5 248 Thailand 5 763 8 335 -2 572 Viet Nam 5 556 13 538 -7 982 Other countries in Asia 17 753 20 515 -2 762 Northern, Central America and the Caribbean 82 958 106 600 -23 642 Canada 8 288 18 551 -10 262 United States of America 67 321 79 160 -11 839 Other countries in North- and Central America 7 349 8 889 -1 540 South America 13 660 35 722 -22 062 Brazil 9 612 22 956 -13 343 Chile 1 641 3 971 -2 330 Peru 333 4 230 -3 897 Other countries in South America 2 074 4 565 -2 492 Africa 15 811 14 947 864 Angola 2 327 58 2 269 Botswana 1 137 -137 South Africa 1 115 4 848 -3 734 Other countries in Africa 8 961 9 904 2 466 Oceania 4 088 2 761 1 326 Australia 3 521 2 189 1 332 New Zealand 447 567 -121 Other countries in Oceania 120 5 115 1Figures for EU is without Great Britain from February 2020 on. Explanation of symbolsDownload table as ... - Export of fish, by species. YearDownload table as ...Export of fish, by species. Year1
Million NOK Change in per cent 2024 2025 2024 - 2025 Total 167 893 173 930 3.6 Salmon2 122 423 124 315 1.5 Cod 11 705 12 726 8.7 Herring 4 244 4 246 0.0 Mackerel 8 291 8 075 -2.6 Coalfish 3 713 4 324 16.5 Haddock 1 659 2 261 36.3 Trout 6 738 7 389 9.7 Shrimps3 : : : Halibut 1 343 1 414 5.3 Ling 436 525 20.4 Cusk 247 377 52.6 Redfish 852 1 023 20.1 Other fish, crustaceans, molluscs and preparations thereof 2 698 2 189 -18.9 Other crustacean/ mollusc 3 545 5 066 42.9 1Within the SITC classification group 03 'Fish, crustaceans, molluscs and other aquatic invertebrates', Statistics Norway has grouped everything by species based on the product groups in the HS nomenclature. Some discrepancies may occur since not all product groups are specified by species. The group 'Other fish' is the sum of the remaining product groups under SITC 03. 2Salmon contains more than the weekly figures of exports of salmon, fillets and other prepared salmon is also included. 3Due to confidentiality in group “Shrimps” from 2013 on, exports in this group can not be published separately. This group is therefore included in commodity group “Other crustaceous animals except shrimps and mollusk”. Explanation of symbolsDownload table as ... - First revision of yearly figures of imports and exports. Commodity groups by SITCDownload table as ...First revision of yearly figures of imports and exports. Commodity groups by SITC1
2025 Imports Exports NOK Million Change in per cent NOK Million Change in per cent TOTAL 1 117 938 0.2 1 778 791 0.2 Of which: Crude oil 8 362 8.9 435 848 -0.3 Natural gas, whether or not liquefied 473 0.0 570 881 0.5 Natural gas condensates 380 13.8 3 748 0.0 Ships and oil platforms 2 138 55.0 251 12.3 Goods excl. ships and oil platforms 1 115 801 0.5 1 779 0.2 Mainland exports . . 768 063 0.3 0 Food and live animals 87 889 0.0 187 602 0.0 00 Live animals other than animals of div.03 265 0.2 105 0.0 01 Meat and meat preparations 2 628 0.0 609 -0.2 02 Dairy products and birds' eggs 2 840 0.0 769 0.0 03 Fish, crustaceans, molluscs and prep. thereof 8 099 -0.1 173 911 0.0 04 Cereals and cereal preparations 10 255 0.0 971 0.0 05 Vegetables and fruit 20 042 0.0 292 -0.2 06 Sugars, sugar prepatations and honey 3 061 0.0 81 0.0 07 Coffee, tea, cocoa, spices 11 214 0.0 848 0.0 08 Feeding stuff for animals (not cereals) 20 001 0.0 6 180 0.0 09 Miscellaneous edible products 9 484 0.0 3 836 -0.2 1 Beverages and tobacco 16 526 0.3 1 362 0.0 11 Beverages 10 907 -0.2 1 267 0.0 12 Tobacco and tobacco manufactures 5 619 1.3 94 0.0 2 Crude materials, inedible, except fuels 65 541 -0.1 32 046 0.0 21 Hides, skins and furskins, raw 47 0.0 245 0.0 22 Oil seeds and oleaginous fruits 2 985 0.0 14 0.0 23 Crude rubber 207 -0.4 66 -2.7 24 Wood, lumber and cork 5 837 0.0 9 677 0.0 25 Pulp and waste paper 576 0.0 4 180 0.0 26 Textile fibres and their waste 194 0.0 320 0.0 27 Crude fertilizers and crude minerales 6 906 -0.1 5 728 0.0 28 Metalliferous ores and metal scrap 44 296 -0.1 10 890 0.0 29 Crude animal and vegetable materials 4 492 0.0 927 0.0 3 Mineral fuels, lubricants and related materials 61 164 1.4 1 107 399 0.1 32 Coal, coke and briquettes 3 838 0.0 79 2 408.6 33 Petroleum, petroleum products 49 794 1.7 492 001 -0.2 334 Petroleum oils and oils obtained from bituminous minerals (other than crude); preparations, n.e.s., containing by weight 70% or more of petroleum oils or of oils obtained from bituminous minerals, these oils being the basic constituents of the preparation 36 291 0.3 51 783 0.0 34 Gas , natural and manufactured 2 439 0.0 588 706 0.5 342 Liquefied propane and butane 1 854 -0.3 16 416 0.0 35 Electric current 5 093 0.0 26 613 0.0 4 Animal and vegetable oils, fats and waxes 16 175 0.0 5 564 0.0 41 Animal oils and fats 6 530 -0.1 2 494 0.1 42 Fixed vegetable fats and oils, crude, refined or fractionated 8 346 0.1 835 0.0 43 Animal or vegetable fats and oils, processed 1 299 0.0 2 235 -0.1 5 Chemicals and related products n.e.s. 118 643 -0.2 84 110 -0.1 51 Organic chemicals 12 320 0.0 18 256 -0.1 52 Inorganic chemicals 11 215 0.1 11 714 -0.1 53 Dyeing, tanning and colouring materials 4 981 -0.1 2 453 0.0 54 Medicinal and pharmaceutical products 36 024 -0.2 13 516 -0.1 55 Essential oils and resinoids etc 15 118 -0.1 3 225 0.0 56 Fertilizers2 5 903 -1.7 : : 57 Plastics in primary forms 6 557 0.0 8 016 0.0 58 Plastics in non-primary forms 9 134 -0.1 2 264 -0.1 59 Chemical materials and products, n.e.s. 17 390 -0.1 8 515 0.0 6 Manufactured goods classified chiefly by material 144 196 -0.1 131 412 2.0 61 Leather, leather manufactures, furskins 400 -0.2 104 0.2 62 Rubber manufactures, n.e.s. 8 820 0.0 1 432 0.0 63 Cork and wood manufactures 9 082 0.0 2 723 0.0 64 Paper, paperboard and manufactures thereof 10 493 0.0 6 996 0.0 65 Textile yarn, fabrics, made-up articles 11 433 -0.1 2 804 0.0 66 Non-metallic mineral manufactures, n.e.s. 12 553 -0.8 2 935 0.0 67 Iron and steel 26 687 0.0 19 054 -0.5 68 Non-ferrous metals 13 370 -0.1 81 146 0.1 69 Manufactures of metals, n.e.s. 51 357 0.0 14 217 23.0 7 Machinery and transport equipment 431 038 0.5 172 210 0.0 71 Power generating machinery and equipment 22 369 -0.4 14 332 -2.2 72 Machinery for special industries 36 175 -0.5 16 209 -0.2 73 Metal working machinery 3 488 0.0 894 0.0 74 General industrial machinery and equipment 65 461 -0.1 32 112 0.5 75 Office machines, data processing machines 43 475 0.0 5 916 -0.1 76 Telecommunications apparatus and equipment 40 148 -0.1 12 964 0.0 77 Electrical machinery and apparatus 71 593 0.1 57 140 0.3 78 Road vehicles 123 200 0.0 16 088 0.0 79 Other transport equipment including ships 25 129 10.3 16 554 0.2 8 Miscellaneous manufactured articles 143 595 0.0 51 887 -0.1 81 Prefabricated buildings 10 373 0.0 2 612 0.0 82 Furniture and parts thereof 19 827 -0.1 3 634 0.0 83 Travel goods, handbags etc. 2 974 -0.2 302 0.0 84 Articles of apparel and accessories 26 866 0.2 3 072 0.0 85 Footwear 7 105 0.0 919 0.0 87 Professional and scientific instruments 27 879 -0.3 22 081 -0.1 88 Photographic and optical goods 5 372 0.0 505 0.0 89 Miscellaneous manufactured articles, n.e.s 43 200 0.0 18 763 -0.2 9 Other commodities and transactions 33 171 12.1 5 200 0.3 91 Postal packages not classified according to kind 0 0.0 0 0.0 93 Special transactions and commodities not classified according to kind 31 082 13.0 719 1.9 96 Coin (other than gold coin), not being legal tender 61 -0.3 8 0.0 97 Gold, non-monetary (excluding gold, ores and concentrates) 2 028 0.0 4 473 0.0 1 2Due to confidentiality commodity group 56 is included in commodity group 59. Explanation of symbolsDownload table as ...
Norwegian import and export - all countries and commodity numbers 1988-2025.
Complete datasets corresponding to Statbank table 08801 for download as CSV.

About the statistics
The information under «About the statistics» was last updated 4 June 2026.
Imports and exports
Imports comprise mainly foreign manufactured goods entering Norway. This can also include re-importation of originally Norwegian-produced goods and processed goods. Exports comprise domestically produced goods sent out of Norway, i.e. the Norwegian statistical territory as defined in Section of population. Also included are reexportation of originally foreign-produced goods and processed goods.
Trade in goods is based on the physical movement of goods across borders, but for some items, such as ships, oil platforms and aircraft, trading often takes place without the occurrence of such movement. Whether there has been an import or export of such goods is therefore determined based on whether a change in economic ownership has taken place cf. also described in the Section of population. Economic ownership is defined as the person entitled to claim the economic benefit and who has the legal responsibility for the risk of the item.
Mainland exports
As from March 2013, the statistics on external trade in goods will use the term mainland exports on the exportation of goods other than crude oil, natural gas, natural gas condensates, ships and oil platforms. Previously, we also used the term traditional goods for these exports, as well as for imports excluding ships and oil platforms. (Balance of payments and the research department still use the term traditional goods. The balance of payments also includes items such as naphtha, propane and butane in its collective term crude oil and natural gas, external trade in goods does not.)
Country
Country of origin is used for imports. With regard to exports, the country of destination is used.
For raw materials, the country of origin is determined according to where the goods are produced. For manufactured goods (processed and refined goods), this is the country in which the goods have obtained the form they have at the time of import. The country of destination is defined as the country, which, on the date of export, is the last known country for which the goods are intended.
For more specific principles in relation to country of origin, the rule for ships, aircraft and oil platforms is that country of origin is the country that previously owned the goods (economic ownership). For Norwegian-produced goods sold abroad and subsequently bought in Norway, the country from which the goods are imported shall be given as the country of origin (manufacturing country).
Country Codes used in the historical tables 1866–1987
The country codes used in table 13625 for the years 1866 to 1975 are partly based on ISO 3166 and partly on constructed codes for countries that were mostly former colonies.
In the country tables, all of which start in 1960, ISO 3166 has been used, with a few exceptions.
Mode of transport
Mode of transport is defined as the means of transportation used when goods cross the border, either by import or export (in the Database for Standard Classifications there is a detailed description of mode of transport).
Quantity
For most goods, the quantity is expressed in kilograms (weight excluding packaging), except for ships and electricity, which are measured by gross tonnes and kWh respectively. However, for many goods, the quantity is also available in a different unit of measurement, such as pieces, barrels, cubic metres, carat, litres, pairs etc.
Statistical value
Statistical value is the value when crossing the Norwegian border. Duties, VAT and other taxes are not included in the statistical value.
Upon import, the value should be set to the CIF (Cost Insurance Freight) value, i.e. the value of the goods at the Norwegian border, including the costs associated with the delivery of goods to the border, transport costs and insurance. Similarly, for exports it is the value at the Norwegian border, including the costs associated with transporting it there, called FOB (Free On Board) value. CIF and FOB are two types of delivery terms called Incoterms. The delivery terms are an agreement between buyer and seller as to who bears the risk, responsibility and cost of transportation of the goods to the agreed place. In the Database for Standard Classifications there is an overview of the different delivery terms.
For crude oil exported by ship directly from installations on the Norwegian continental shelf, the value upon departure from the installation is used. In the case of crude oil and natural gas that is piped abroad, this value is determined based onon when it leaves the Norwegian continental shelf. The value of transport in international waters and into a terminal abroad is regarded as export of services.
The statistical value of exports and imports of ships is the transfer value including takeover of debt. With regard toto fish landed abroad (exported) by Norwegian vessels and caught outside the Norwegian customs border, the statistical value is the value of the fish paid to the fishing operator upon the sale of stock (minus the sales organisation fee).
County of production
The county of production is defined as the county in which the added value is greatest.
Classification of goods
The classification by HS (the international customs and statistics nomenclature, the Harmonized System) is a 6-digit grouping of goods organised primarily according to the material characteristics of goods at the time of crossing the border. Only in exceptional cases is the later use of the goods of any significance to the classification. The WCO (World Customs Organization) is responsible for this nomenclature.
The Norwegian customs tariff is based on the HS, but has two more digits, which are national codes. The 7th digit reflects national customs divisions/tariff rates (bound in the WTO - World Trade Organization). The 8th digit is used to cover the national statistical needs and and among others the interests of the Norwegian Agricultural Authority and Ministry of Foreign Affairs interests with regard to import and export regulations. In some cases, the 8th digit is also used to distinguish between goods subject to duties and/or fees. The Norwegian version is published annually on our website along with a text version of the nomenclature developed by Statistics Norway. The detailed commodity list, which includes all commodity numbers, also provides information about the validity of each commodity number.
Due to technological developments and changes in international trade, the HS nomenclature is normally updated every 5 years – with the most recent implementation on 1 January 2012. In addition, minor changes are made in the Norwegian customs tariff every year. The EU also uses the nomenclature of the HS in its publication of foreign trade figures. However, the EU version (available at Eurostat's website); the Combined Nomenclature (CN) - which also has eight digits - is more detailed than the Norwegian version. As mentioned previously, only the first 6 digits are common internationally.
When publishing external trade figures, the UN Standard International Trade Classification (SITC) is mainly used. Here the goods are grouped by level of processing (raw materials, semi-finished and finished goods). As from 1988 to 2006, the SITC-Rev.3 (unstats.un.org) is used, but as of 2007 the SITC-Rev. 4 (available at unstats.un.org as PDF) is used.
The classification BEC (Broad Economic Categories) (at unstats.un.org); the UN classification of commodities by end use, which is based on the SITC, is also used to some extent. This classification is not considered to be a "standard classification" in the same way as for example the SITC, and it is officially acknowledged that countries may have their own version of this grouping in order to satisfy national needs. The Norwegian version of this classification can be found in the Database for Standard Classifications.
The various nomenclatures are listed on the UN’s website, as well as correspondence tables between the different nomenclatures HS, SITC and BEC and their different versions.
The product classification CPA divides goods by industry group, and in external trade we use extracts from this. CPA (Statistical Classification of Productivity by Activity in the European Community) is the EU's central Product by Activity classification. It is a product group that is closely linked to industry, i.e. distinctive products within each activity can be linked to the activity classification NACE Rev.2.
Grouping by country
The Norwegian list of countries used follows the international standard ISO-3166. EU countries use the same standard, except for some deviations of less importance.
In the external trade publications these country groupings are frequently used:
- Nordic countries - trade with Sweden, Denmark, Greenland, Faroe Islands, Finland, Åland and Iceland
- EFTA - trade with Iceland, Switzerland and Liechtenstein. European Free Trade Association - Wikipedia
- EU – in the Database for standard classifications current member states at any given time is available
- OECD - for current member states at any given time see the OECD's website
- Developing countries – as from 2007, the figures are according to the OECD’s DAC (DAC stands for Development Assistance Committee) for definitions of countries at any given time that are recognised as recipients of official foreign aid. The DAC list also includes a section on LDCs (Least Developed Countries - defined by the UN) - which we also use in the statistics.
(Until 2006, these countries were defined as developing countries in the Norwegian trade statistics: Bosnia-Herzegovina, Yugoslavia (Serbia and Montenegro), Croatia, Macedonia, Malta, Slovenia - Africa except South Africa - Asia excluding Japan, North and South America except USA, Canada and Greenland - Oceania except Australia and New Zealand.)
Name: External trade in goods
Topic: External economy
Division for External Trade Statistics
Statistics on imports and exports of goods are published at country level. Export figures are also given by county of production.
Monthly figures are released on the 15th of the month after the observation period (the previous month), or the first subsequent working day. With every new release, all the previous monthly figures are updated in every publication.
For more information about Revisions, please see Accuracy and Reliability.
Reports are sent to the EU statistical office (Eurostat), Organization for Economic Cooperation and Development (OECD), World Trade Organization (WTO), International Monetary Fund (IMF) and the United Nations (UN).
Non-revised and revised micro data are stored in accordance with Statistics Norway's guidelines for storing computer files (DataDok).
The purpose of the external trade statistics is to provide information about the commodity flows between Norway and other countries. Exports and imports are important economic indicators both in describing structural changes and in monitoring the economic trends. The monthly statistics of external trade in goods have been published since 1913 (value figures were published for the first time in 1866).
With regard to essential changes in the statistics, the commodity classification in line with the Harmonised System that was introduced in 1988 entailed a comprehensive restructuring of the distribution at a detailed level in relation to the earlier CCCN nomenclature (the Customs Cooperation Council Nomenclature).
The statistics are mainly financed from State assignments, but also rely to some extent on market income.
The external trade statistics are a part of the national and international statistical system, and are used in the compilation of the national accounts and the balance of payment statistics in Statistics Norway. The statistics are aimed at covering the business sector’s need for data in this area for their planning of production, marketing and sales.
The statistics are also intended for prognoses and analyses performed by public authorities, research institutions and private organisations. International organisations such as the UN´s statistical office, the Organization for Economic Cooperation and Development (OECD), the statistical office of the EU (Eurostat) and others make use of the information provided in the external trade statistics.
No external users have access to the statistics and analyses before they are published and accessible simultaneously for all users on ssb.no at 8 am. Prior to this, a minimum of three months' advance notice is given in the Statistics Release Calendar. This is one of Statistics Norway’s key principles for ensuring that all users are treated equally.
The figures for external trade statistics are an important part of the quarterly balance of payments and national accounts and the annual national accounts.
The balance of payments also collects estimates of trade in goods which are transported directly from abroad to the Norwegian continental shelf, imports of fuel and other oil products to Norwegian ships, aircraft and units abroad. Moreover the external account interprets some of the goods from the external trade statistics in goods as a service, such as computer games, software and licenses.
In the publication of the figures for external trade we give figures for crude oil, natural gas and condensates, while the balance of payments use the collective term “crude oil and natural gas”. Terms in foreign accounts also encompass items such as naphtha, propane and butane, while the external trade statistics do not.
In addition to the statistics mentioned, external trade figures are included in many of the other statistics published by Statistics Norway, for example:
- Exports of salmon, weekly figures of salmon exports are published in addition to the regular monthly trade figures
- Indices of volume and price of external trade in goods mainly use external trade data as the basis for calculating figures. In addition, the total number of imports and exports, as well as fish and some selected commodity numbers for waste paper and scrap metal, are used as basic data in the producer price index and the price index of first-hand domestic sales
- External trade data are also used as basic data for statistics on fishery and emissions of greenhouse gases.
Mirror statistics
Mirror statistics, in the context of external trade statistics, refer to a comparison between the statistics of two or more countries: exports of goods from one country should in principle equal the imports of the same goods in the partner country.
However, discrepancies are often identified in these figures for several reasons. Although there are international guidelines for the production of external trade statistics, there may still be differences in what the countries include. An example is differences in the usage of statistical trade systems, general or special trade, which causes delimitations to the statistics content. Countries may also have different methods for data collecting and processing, which can create distortions. Furthermore, some countries collect data from customs authorities and others directly from companies.
Basically, there should be a certain difference in value between the countries, as the exporting country provides the FOB-value while the importing country in addition to this adds costs for insurance and freight all the way to the location of delivery, the CIF-value (see Definitions). Some countries collect data from customs authorities, others directly from companies. A common source of error between countries is caused by different information about which is the country of destination. Different threshold-values for inclusion of data can also create distortions, f.ex. in Norwegian external trade statistics, declarations with value less than NOK 1 000 are excluded from the import statistics. Other countries may have other delimitations. Different practise of confidentiality and demands for confidentiality, inaccurate definitions of certain commodities as well as conscious and unconscious misuse of codes can lead to use of different classification codes between countries.
From a Norwegian point of view, there is a need for comparing external trade data with the corresponding statistics of our main trading partners, principally European countries. It is in this context important to have knowledge of the rules practiced by the individual partners.
The Statistical Office of the European Union, Eurostat, publishes external trade data for EU countries, totally for the Union and separate for each member country. This statistics are produced according to EU regulations, which defines external trade as trade between the European Union trade and third countries. As a consequence of this, exports to countries in the EU from a non EU-member state are recorded as imported to EU in the first country where the goods cross the borders of the European Union. When forwarding the goods to the country of destination, the good is recorded as an item dispatched from the EU-country that first received the goods. Information about the country of origin of the commodity is not included in the records. Several of the EU-countries publishes in addition to the data presented in the Eurostat database, Comext, separately external trade statistics produced after national methodology. For information about this, consult Eurostat's annual report: Quality report on International trade statistics.
EU regulations incorporated into the EEA agreement comprise contractual obligations pursuant toto EC regulations onon data collection and distribution of data to the EU’s statistical office, Eurostat. The current regulations are as follows:
Commission Regulation (EU) No. 92/2010 of 2 February 2010 implementing Regulation (EC) No. 471/2009 of the European Parliament and of the Council on Community statistics relating to external trade with non-member countries, as regards data exchange between customs authorities and national statistical authorities, compilation of statistics and quality assessment
Commission Regulation (EU) No. 113/2010 of 9 February 2010 implementing Regulation (EC) No. 471/2009 of the European Parliament and of the Council on Community statistics relating to external trade with non-member countries, as regards trade coverage, definition of the data, compilation of statistics on trade by business characteristics and by invoicing currency, and specific goods or movements
Commission Regulation (EU) No. 1106/2012 of 27 November 2012 implementing Regulation (EC) No. 471/2009 of the European Parliament and of the Council on Community statistics relating to external trade with non-member countries, as regards the update of the nomenclature of countries and territories
Statistics area and the economic territory
The scope of foreign trade statistics is based on international guidelines from the United Nations Statistical Commission.
The general recommendation is that the statistics should include all goods which add to or subtract from the stock of material resources of a country by entering (imports) or leaving (exports) its economic territory. In addition to the geographical dimension, a country's economic territory also includes ships, aircraft and oil platforms owned by national corporations. These are goods that are not necessarily located within the geographic area, but are still viewed as part of the material resources of a country. For these goods external trade is measured by the change of economic ownership.
There are two different statistical trade systems - the general trade system and the special trade system. UN recommends using the general trade system where a country's statistical area coincides with its economic territory. This implies that goods are recorded at the time they enter or leave the economic territory. The special trade system is used when the statistical area covers only a part of the economic territory. Statistics Norway follows, with a few exceptions, the general trade system.
The Norwegian economic territory consists of mainland Norway, Svalbard, Jan Mayen, Norwegian dependencies, territorial waters, including the airspace above these, the economic zone, the Norwegian part of the continental shelf, territorial enclaves abroad (embassies, consulates, military bases, research stations) and Norwegian ships, aircraft and oil platforms.
External trade statistics is mainly based on information drawn from customs declarations. However, the responsible area of the customs authorities only covers mainland Norway and its territorial waters. As a supplement, data on important trade in goods to and from the remaining areas of the economic territory are collected directly from respondents and registers.
The following are defined as statistical area:
Mainland Norway and its territorial waters
Customs declarations contain information on physical flows of goods crossing the customs border. Imports and export that are exempted from ordinary declaration are referred to in the Customs Act §§ 4-10 and 4-11. According to the recommendations from the UN, some flows of goods should be excluded from the statistics. This includes trade in Norwegian goods between the customs area and other parts of the Norwegian economic territory. To the extent possible, trade in foreign goods to and from foreign enclaves, ships, aircraft and oil platforms located in Norway are omitted. To distinguish this type of transactions customs procedure codes from the declarations are used. In general, trade transactions are recorded at the time when the goods enter or leave the customs territory. However there are some exceptions, cf. the treatment of goods in customs warehouses.
There are four different types of customs warehouses. Goods waiting on declearance,can be stored in either a general or a central warehouse. For imports the time of recording is set when the goods are taken out of the warehouse and not when they arrived in the economic territory. This means that the statistical processing of these data follows the special trade principle. However, in practice the time difference between storage and withdrawals from warehouses is usually so small that the statistical processing is considered to be approximately equal to the general trade principle. For the remaining two types of customs warehouse; duty free and storage for further processing, the statistical treatment is according to the general trade system.
Customs declarations of exports and imports of electric current do not provide enough information for statistical purposes, and data is therefore obtained directly from the respondent.
Svalbard and Jan Mayen
Import transported through the Norwegian mainland to Svalbard and Jan Mayen should be declared by customs. Data on exports of coal transported directly from Svalbard are collected directly from the respondents.
The Norwegian part of the continental shelf
Imports via the Norwegian mainland to Norwegian owned installations and vessels that operate on the continental shelf should be declared by customs. Exports of crude oil and natural gas delivered directly from the continental shelf are based on data from the Norwegian Petroleum Directorate and the different operators.
Norwegian owned ships, aircraft and oil platforms
Exports and imports of ships, aircraft and oil platforms are based on information from Norwegian ship registers as well as from different respondents. Export of Norwegian goods (excluding bunkers) to foreign ships and aircraft in Norwegian ports and airports are covered by customs declarations.
Data on exports of fish caught by Norwegian fishing vessels outside the customs area and landed abroad is obtained from the Directorate of Fisheries.
In accordance with the UN recommendations the following trade in goods are not included in the statistics:
- Goods in transit, ie goods attending the Norwegian economic territory to be directly transported to a recipient outside this area
- Goods traded through intermediate trade, ie goods transported between two foreign countries without entering the Norwegian economic territory
- Goods physically crossing the country border, but defined as a service (including newspaper subscriptions, accompanied baggage, household goods)
- Content delivered electronically (including e-books, downloadable games, etc.), defined purely as a service
- Issued banknotes, securities and monetary gold
- Samples, gifts and promotional material etc. with a low value
- Goods for repair or return after repair
- Goods in unaltered condition in return to vendor (claims etc.) and waste containers, replacement deliveries and free repairs (warranty)
- Items for temporary use, that are returned within 12 months (exhibition, demonstration, scientific research, loan, professional equipment, transport vehicles in international traffic, containers, equipment in use for the press, radio and television equipment, etc.)
- Change in ownership of non-financial assets
- Goods that are damaged on the journey to and from the Norwegian economic territory
- Satellites equipment moved to and launched in other countries without any change of ownership
- Goods functioning as means of transport (ship, aircraft, packaging, etc.
Furthermore goods totalling less than NOK 1 000 are omitted, these goods amounts to less than one per cent of the import and about 0.04 per cent of the export. Imports of goods for less than NOK 200 and exports of goods less than NOK 5.000 (except from goods that are subject to taxes and restrictions) are not subject to declaration by the Customs.
The statistics are mainly based on administrative information obtained from TVINN, which is the Norwegian Customs’ electronic information system for the exchange of customs declarations between businesses and Norwegian Customs. Some data is, however, obtained from other sources, and more information on this can be found in the paragraph on data collection.
Sampling is not not relevant as external trade is a total count of the goods defined in the population.
Data collection
The vast majority of the data is, as mentioned, collected through the Customs’ TVINN register and transmitted electronically to Statistics Norway. However, some additional data, as shown below, is obtained separately.
Exports of crude oil and natural gas in gaseous state
Preliminary and final figures for exported volumes of crude oil and natural gas in gaseous state are collected through monthly reports from the operators and the Norwegian Petroleum Directorate. The prices, however, are obtained via various sources depending on whether they relate to crude oil or natural gas, and whether the data is being collected to compile preliminary or final figures.
From 2013 onwards, developments in gas prices from the Producer and wholesale price indices (PPI) have been used to estimate preliminary natural gas prices in the external trade statistics. Statistics Norway (SSB) estimates a preliminary gas price based on developments in spot prices for Germany, France, the United Kingdom, Belgium, and the Netherlands, using data from the European Gas Spot Index. The PPI gas price index is then chained to the latest available gas price level in the external trade statistics.
Up to and including 2023, a weighted average price was used, meaning that the same gas price was applied to all destination countries. The methodology was revised from 2024 onwards to account for differences in gas prices between countries, allowing country-specific gas price estimates.
Preliminary oil prices are based on the reference price of Brent Blend for the current month.
For crude oil, the final prices: quarterly surveys from the licensees, as well as information from the Norwegian Petroleum Directorate, the Ministry of Petroleum and Energy and the operators.
Up to and including 2019, final natural gas prices were calculated as quarterly average prices, based on information provided by a sample of license holders and Gassco. From the publication of the final 2020 figures onwards, monthly prices were used for the final statistics as well.
The final prices are based on a broader price basis than the preliminary prices. Unlike the preliminary prices, the final prices are based on the license holders' actual sales of natural gas. In addition to day-ahead prices, the price basis includes, among other price references, month-ahead and quarter-ahead prices, as well as contracts linked to oil prices. We receive price information from license holders covering approximately 90 per cent of the exported volume. The price for the remaining share is estimated using this information.
Due to insufficient information about country of destination there are from 2013 on changes in the dissemination of the figures of exports of natural gas in gaseous state. From 2013, country of destination according to these figures will be based on the landing point of the pipelines with natural gas from the Norwegian continental shelf.
Exports of crude oil in pipelines to Great Britain
All exports of Norwegian crude oil that are transported by pipeline to Teeside are registered in the official statistics with the UK as the country of destination. The ownership is Norwegian until the oil is processed in Great Britain, but because a commodity is registered as exported when it physically has crossed the Norwegian border.
After this unstabilized crude oil has gone through a fractionation process, where it is separated into the components of stabilized crude oil, ethane, propane and butane, it is shipped onwards, thus giving a new country distribution. Crude oil has to be stabilized in order to be transported by ship.
Only those shipments regarded as genuine importation into Great Britain is regarded are included in the statistics of Great Britain. All other flows are regarded as being in transit, and therefore excluded.
The figures by country in Statbank table 12780 for “Crude oil, incl. oil by pipelines after processing in Great Britain” shows reallocated figures after country of destination for oil exports by pipe lines (to Great Britain) and by ship to all countries.
Only those shipments regarded as genuine importation into Great Britain is regarded are included in the statistics of Great Britain. All other flows are regarded as being in transit, and therefore excluded.
The fractionation process implies that some of the crude oil disappears, thereby different total figures.
Imports and exports of ships and oil platforms
The data collection for vessels is based on current information from the Norwegian ship registers the Norwegian Ordinary Ship Register (NOR) and the Norwegian International Ship Register (NIS).
When it comes to oil platforms, information is collected from the Norwegian ship registers, the Customs’ TVINN register and importer/exporter.
Imports and exports of electricity
Information is received from Statnett. The volume of imports and exports of electricity is measured by the net transfer of the power grid junction point towards foreign countries and is registered every hour. The value of this trade is calculated by multiplying the amount of electricity transferred per hour with Norpools market price for the current hour. Thereafter the figures are aggregated to a monthly level.
From October 2025, the method for calculating electricity has been changed from hourly to 15-minute intervals. This creates a discontinuity in the data, and users should be aware that the figures before and after this date are not directly comparable.
Imports and exports of aircraft
For some aircrafts, monthly reports are received from Statistics Sweden, while the rest are obtained through regular declarations in the TVINN system.
Exports of coal from Svalbard
Reports on the export of coal from Svalbard are received yearly from the exporter.
Exports of fish caught by Norwegian vessels outside the Norwegian customs border
In the period July 2010 - December 2023, the figures have been obtained from the Directorate of Fisheries (FDIR). Prior to and after that, the information was gathered through TVINN.
Lov-value shipments besides VOEC consignments
For commodity codes 99.60.1000 and 99.60.2000 cover customs-declared goods, and the information is obtained from customs declarations. The goods are divided into two commodity codes indicating whether the recipient/sender for imports/exports is a consumer or a business. Due to simplified declaration procedures, statistics for low-value shipments are less detailed. The trade is aggregated into total values, and the country of origin or destination is unspecified.
In the publication of May 15th 2025, commodity codes 26.21.1000 and 38.25.1000, which cover municipal waste, were expanded to include observations with value less than NOK 1.000. The change applies from 2023. This will result in a break in the time series for these commodities from 2022 to 2023.
Import of VOEC consignments
VOEC (VAT on E-Commerce) is a simplified scheme established for sellers and online marketplaces to charge and report VAT on business-to-consumer supplies of low value goods. Information about VOEC goods is collected from administrative data from the Norwegian Tax Administration. Each quarter, foreign VOEC-registered businesses must report and pay the VAT collected during the previous quarter. Corrections for earlier periods can also be included in the VAT returns, due to misreporting, returns of goods, or other reasons. The value of VOEC imports is calculated based on the VAT basis, adjusted for any corrections.
Due to quarterly reporting, monthly figures are estimated by dividing the quarterly amount across the relevant months. This reporting frequency means there is a time lag in the monthly statistics.
Due to insufficient information about volume, Statistics Norway has estimated the weight of VOEC goods based on private individuals' imports in the TVINN data. The calculation basis is limited to goods valued up to NOK 3,000, corresponding to the value limit in the VOEC scheme.
As with other low-value shipments, trade in VOEC goods is less detailed due to exemption from customs declaration.
Re-exports and returns of low-value shipments
Generally, exports of goods less than NOK 5,000 are not subject to declarations by the Customs. A large share of the low-value shipments that are re-exported will therefore not be declared in TVINN. Corrections reported in VAT returns to the Tax Administration for VOEC goods contain no identifiers to distinguish between misreporting, returns of goods, or other factors.
Data editing
Information from customs declarations is subject to statistical controls in the Customs declaration system (TVINN). The controls to check the estimated price, quantity and country were developed by the Customs in cooperation with Statistics Norway.
Data controls at Statistics Norway take place at different levels - some as soon as the data is loaded into the system (automatic recoding of variables). The manual part of the revision consists of different types of validity and probability tests. The former are controls of absolute errors, such as missing transport code, while the other type of test may check unlikely country codes or unreasonably high quantities for a specific type of good. The system aims to intercept the most serious errors in the data. Data collected from sources other than the Customs also undergo similar checks.
Estimations
External trade is based on a total count but some items are excluded, cf. section of population. There is no need for any statistical estimations of current figures, only aggregations, in order to enable us to publish in a timely manner.
The methods and routines used to produce seasonally adjusted figures are described in the chapter About seasonal adjustment.
The Statistics Act § 7 covers the disclosure of information.
The requirements for confidentiality in external trade of goods are practised so that data is suppressed only when the establishment/enterprise has a valid reason for confidential treatment and actively asks for it. Exporters/importers can demand suppression when there are 3 or fewer companies that import or export an item type to a given country, or when a company has a market share of over 90 per cent, or if two firms have a market share of over 95 per cent.This is called "passive confidentiality" and is in line with UN recommendations. This method is used by most countries..
Since Norway has a number of major manufacturers that are dominant in some product areas, some suppression of information exists on the export side. Between 5 and 10 per cent of mainland exports are affected by confidentiality. For imports, it is far less; around 1 per cent. Some commodity areas are more problematic with regard to dissemination, since suppression on highly aggregated levels must be carried out.
The six-digit HS-based commodity classification is subject to revisions due to technological development and also development in the commodity spectres of the international trade. These adjustments are normally made every five years. The most recent HS revision was implemented on 1 January 2012. Furthermore, national adjustments are made every year at the national eight-digit level. These revisions can create breaks in the time series for some commodity numbers. Detailed information about this is available in the yearly Commodity List External Trade. Correspondence tables between the different editions of the HS are available on the UN website.
With regard to the divisions according to the SITC, the current SITC-Rev.4 was introduced in January 2007, when it replaced the previous SITC-Rev.3 (1988-2006). The relation between the figures for the years before and after 2007 can be misleading for some commodity numbers. The degree of influence depends on the value of the commodity numbers that now have a different group affiliation. Correspondence tables between the different editions of the SITC are also available on the UN website.
For the tables that use the CPA nomenclature, the 2008 edition is used for the whole series.
Other elements influencing the comparability over time: The imports and exports of ships and oil platforms in the statistics were extended in 1991 to include transactions that concern vessels under a foreign flag with a Norwegian-registered holding company. Furthermore, the definition of developing countries was changed in 2007, which affects the figures slightly.
The data material in the External trade in goods statistics is very extensive, and at the most detailed level the quality can vary. The quality will be affected by errors in reported data. Collection errors can occur from incorrect values, incomplete information or misinterpretation of data on customs declarations. Examples of this are use of wrong commodity number, country code, county of production or incorrect quantity.
Users of the statistics must therefore consider this when using detailed figures. Commodity numbers with little trade, measured in value, will be more prone to errors than commodity numbers with a lot of trade. Furthermore, the statistical variables weight and quantity have poorer quality than value. Goods with restrictions and trade to particular countries are, however, monitored more closely.
Statistics Norway is required to report detailed figures to Eurostat, and therefore finds it appropriate that the figures are also published to Norwegian users, despite the varying quality.
Other sources of error include late updates, which sometimes occur for the trade with ships and oil platforms. The rules for customs clearance, which entail exemption from the duty to declare for goods with value below a set value, lead to lower figures than the real trade. This is not the best solution for preparation of the national accounts, where these lacking figures are estimated separately.
The calculation of seasonally-adjusted data beyond the usual seasonal effects is adjusted for the fact that trade is distributed unevenly across the week and taking into account the effect of Easter, as described in the section of estimations. However, beyond this nothing in particular is done. Therefore, it would be natural to assume that the seasonally-adjusted December figures should be interpreted more cautiously because of the Christmas holidays.
The export trade statistics is a full count, so there are therefore no non-response errors or sampling errors.
When publishing statistics for a new month of measurement, figures for the previous months in the same year are also revised. Furthermore, the figures for all months of the year are revised twice more: First time in May the following year (year t + 1), before final figures are published in May one year later (year t + 2). See External trade in goods tables in the Statbank in for more information about the size of the revisions.
At the aggregate level, the difference between preliminary monthly figures and revised figures published in May year t + 1 will normally be small for imports and mainland exports. At a detailed level and for individual months, the revisions can be of greater importance, relatively speaking. For oil and gas, larger audits can be experienced, in particular, related to the calculation of oil and gas prices. The revisions of the final publication in year t + 2 will normally be of minor importance, but in some cases relatively significant corrections can also be uncovered in this time perspective.
Monthly and quarterly time series are often characterised by considerable seasonal variations, which might complicate their interpretation. Such time series are therefore subjected to a process of seasonal adjustment in order to remove the effects of these seasonal fluctuations. Once data have been adjusted for seasonal effects by X-12-ARIMA or some other seasonal adjustment tool, a clearer picture of the time series emerges.
More information on seasonal adjustment, metadata on methods.
Many commodities in external trade in goods have a pattern that appear repeatedly at about the same time every year.
An example of seasonal variation for external trade in goods is the export of fish, where the seasonal pattern is influenced by fish species having different fishing seasons and international demands. The export of skrei is highest in February and March, and the salmon export highest towards the end of the year. Another example is the export of natural gas, where the amount exported varies with the winter and summer seasons, due to different demand from European countries.
To be able to follow the underlying development from month to month without being influenced by such variations, the figures are seasonally adjusted.
Pre-treatment is an adjustment for variations caused by calendar effects and outliers.
We follow the European Statistical System (ESS) guidelines on seasonal adjustment (ec.europa.eu) as far as possible. When background information for an outlier is available, the outlier is included as an explanatory variable (regressor) in the model.
For handling the corona crisis in the seasonal adjustment, we follow Eurostat's guidelines (available on Eurostat's web site as PDF), which state that the effect of the corona crisis should not be included in the basis for estimation of seasonal factors.
Calendar adjustment
Calendar adjustment contains both adjustments for trading days effects and for moving holiday effects. Adjustments for trading days means that we adjust the raw data so that both the number of working days since the composition of these can vary from period to period.
Calendar adjustment is carried out on all series that show a significant and plausible calendar effect with RegARIMA procedure (a regression model where the noise term is modelled by an ARIMA model).
Calendar regression variables are processed in accordance with the Norwegian holidays and public holidays.
Methods for trading/working day adjustment
RegARIMA correction is used – in this case, the effect of trading days is estimated in a RegArima framework. The effect of trading days can be estimated by using a correction for the length of the month or leap year, regressing the series on the number of working days etc. In this case, the residuals will have an ARIMA structure.
Correction for moving holidays
Test for moving holidays’ effect of Easter holiday after the X-13-ARIMAs impact modell. Very few series have a significant moving holidays’ effect.
National and EU/euro area calendars
Use of the Norwegian calendar, which considers Norwegian working days and public holidays.
Treatment of outliers
Outliers, or extreme values, are abnormal values of the series.
Series are inspected to identify outliers. Once identified, outliers are explained/modelled using all available information. Outliers for which a clear interpretation exists (changed methodology in data collections, special events and consequences of government policy changes etc.) are included as regressors in the model.
The identified outliers are predefined in pre-adjustment’s model. Program will only search for the last year for outlier. They are detected automatically by the seasonal adjustment tool. The outliers are removed before seasonal adjustment is carried out, and then reintroduced into the seasonally adjusted data.
Model selection
Pre-treatment requires choosing an ARIMA model, as well as deciding whether the data should be log-transformed or not.
Model selection is automatic, by JDemetra+’s established routines.
Decomposition routine
The decomposition routine specifies how the trend, seasonal and irregular components are decomposed. The most common decompositions are the multiplicative, additive or log additive.
We have used an automatic decomposition scheme selection in JDemetra+, and multiplicative decomposition is used for most series in this model.
Choice of seasonal adjustment approach: X-13 method in JDemetra+ (github.io)
Consistency between raw and seasonally adjusted data
In some series it is preferred that, for example, the sum of monthly seasonally adjusted figures for a year should be identical to the sum of monthly figures in the original raw series.
For the external trade statistics, no consistency conditions are applied.
Consistency between aggregate/definition of seasonally adjusted data
In some series, consistency between seasonally adjusted totals and the original series is imposed. For some series there is also a special relationship between the different series, e.g. GDP which equals production minus intermediate consumption.
Due to indirect approach for aggregates, the consistency is automatically fulfilled.
Direct versus indirect approach
Direct seasonal adjustment is performed if every time series, including aggregates, are seasonally adjusted on an individual basis. Indirect seasonal adjustment is performed if the seasonally adjusted estimate for a time series is derived by combining the estimates for two or more directly adjusted series.
A total of 38 seasonally adjusted series are published. Main aggregates such as total imports, total exports, mainland exports are seasonally adjusted indirectly. Furthermore, we have seasonally adjusted import and export series according to the one-digit SITC. All these series are value series. We find seasonal patterns for all these series, except SITC9 where series are adjusted mostly for calendar effects and the results from seasonal adjustment is uncertain.
The important export commodities crude oil, natural gas in gaseous form, fish (SITC03), metals other than iron and steel (SITC68) and electricity (SITC35) are seasonally adjusted for both value and volume, where volume series are direct adjusted and value series are indirectly adjusted.
Horizon for estimating the model and the correction factors
When performing seasonal adjustment of a time series, it is possible to choose the period to be used in estimating the model and the correction factors. Correction factors are the factors used in the pre-treatment and seasonal adjustment of the series.
The time series from January 2011 on is used to estimate the model and the correction factors.
General revision policy
Seasonally adjusted data may change due to a revision of the unadjusted (raw) data or the addition of new data. Such changes are called revisions, and there are several ways to deal with the problem of revisions when publishing the seasonally adjusted statistics.
In accordance with recommendations from the ESS guidelines, the models behind the seasonally adjusted figures will be subject to a thorough review once a year.
Concurrent versus current adjustment
Partial concurrent adjustment: the model is identified and estimated yearly, while filters, outliers (last year) and regression parameters are re-identified and estimated continuously as new or revised data become available.
Horizon for published revisions
The revision period for the seasonally adjusted results is limited to 4 years prior to the revision period of the unadjusted data, while older data are frozen.
Evaluation of seasonally adjustment data
A detailed set of graphical, descriptive, non-parametric and parametric criteria defined to assess the relevant characteristics of seasonally adjusted data are used.
Quality measures for seasonal adjustment
A set of available diagnostics within the seasonal adjusted tools and graphical capabilities are used.
A table containing selected quality indicators for the seasonal adjustments is available. The table is available here: indicators_seasonaladjustment (XLSX)
More information about the quality indicator is found here: metadata on methods: seasonal adjustment (PDF).
Seasonal adjustment of short time series
All series are sufficiently long to perform an optimal seasonal adjustment.
Treatment of problematic series
Following the Corona crisis that started in the 1st quarter of 2020, the seasonal adjustment follows the Eurostat guidelines for how to treat this extraordinary event. The result being that the effect of the Corona crisis is not a part of the foundation of the seasonal patterns. We assume that the seasonal pattern is unchanged, and that we correct for the systematic seasonal variation calculated on data before the corona crisis.
Data availability
Unadjusted figures (original series or raw data) and seasonally adjusted are available.
Contact
Opplysningstjenesten for utenrikshandelen
utenrikshandel@ssb.noRelatert innhold
Analyses, articles and publications
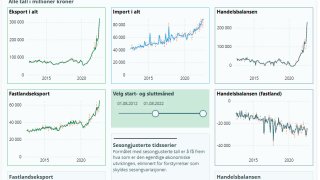 Article / 15 October 2026Visualisation of seasonally adjusted figures for external trade in goodsWhat is shown in the latest figures for external trade in goods ? The unadjusted monthly figures are affected by calendar effects and seasonal variations. Seasonally adjusted series are better for evaluating changes in the economic indicators over time. The number of series for seasonally adjusted figures in the Statbank is now increased from 6 to 38 and most of these are included in this visualisation.
 Article / 11 February 2026Commodity List External TradeThe Commodity List follows the nomenclature of the Norwegian Customs Tariff, as from 1988 based on the combined tariff/statistical nomenclature, the Harmonized System (HS).
 Article / 26 June 2025Production of External Trade in goods Statistics – A historical overviewHistorical time series on external trade in goods have now been digitized and made available in a publicly accessible database – “The Statistics Bank”. This article provides a description of the statistical classifications that form the basis of the historical time series, which date back to the first half of the 19th century. Hopefully, these time series will be both useful and enjoyable for a wide range of users.