Content
Published:
This is an archived release.
Good times for hotels and restaurants
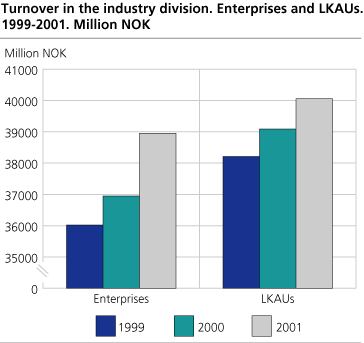
Norwegian hotels and restaurants industry division had a turnover of NOK 40 billions in 2001. This is an increase of NOK 1 billion compared with the previous year and nearly an additional billion compared with 1999.
The figures for the enterprises in the hotels and restaurants industry division in 2001 show an increase of NOK two billions compared with 2000, while employment increased by 2750 employees. However, this increase is partly due to restructurings in the wholesale and retail industry division, where a large number of restaurants and cafés have been separated into their own enterprises. Without these restructurings, the increase in turnover for hotels and restaurants would have been just half of what the statistics indicate, while employment would have been roughly the same as in the previous year.
The consequences of the restructurings on enterprise level are made more evident on the local kind-of-activity units (KAUs) level with the number of local KAUs barely changing and the turnover growing by nearly NOK one billion in the same period. The development in the period 1999 to 2001 was stable for these two variables on the local KAUs level.
Low growth in value added
Despite the growth in turnover for the local KAUs, the increase in the total value added at factor cost was not equivalent. The total value added at factor cost grew by NOK 148 millions to more than NOK 16 billions. The reason for the total value added at factor cost not increasing further, was that the operating costs grew more rapidly than the operating income.
Higher spending in Oslo and Akershus
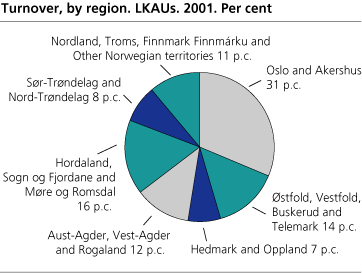
Of the NOK 40 billion turnover in the industry division the hotels and restaurants in Oslo and Akershus constituted 12.5. In other words, nearly NOK one out of three were spent on hotel and restaurant services in these two counties, whereas only one out of five local KAUs was situated here.
Comparison with previous years
In addition to the abovementioned restructurings some of the changes are due to a relative extensive revision of the industry classification in the Central Register of Establishments and Enterprises. This complicates a comparison with previous years of the subgroups. Subsequently, the changes do not necessarily reflect real changes. For the entire industry division this is not a problem as most changes have been within the division.
Local KAUs and enterprises
The figures on the enterprise level may differ from those on local KAU level. This is due to some enterprises being registered in one industry subclass after main activity, but also consisting of local KAUs in other subgroups.
More about this and other definitions can be found in the "About the statistics".
Tables:
- Table 1 Hotels and restaurants. Main figures, by industry subclass. Local kind-of-activity units. 1999-2001
- Table 2 Hotels and restaurants. Main figures, by number of people employed and industry group. Local kind-of-activity units. 2001
- Table 3 Hotels and restaurants. Main figures, by county. Local kind-of-activity units. 2001
- Table 4 Hotels and restaurant. Main figures, by industry subclass. Enterprises. 1999-2001
- Table 5 Hotels and restaurants. Main figures, by number of people employed and industry group. Enterprises. 2001
The statistics is now published as Business statistics.
Contact
-
Statistics Norway's Information Centre
E-mail: informasjon@ssb.no
tel.: (+47) 21 09 46 42


