Content
Published:
This is an archived release.
The smallest enterprises dominate
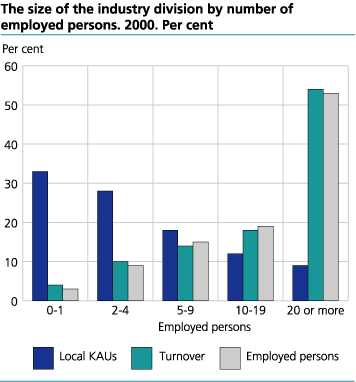
The smallest hotel and restaurant enterprises have most employed persons , whereas the largest enterprises made more than half of the turnover in all hotels and restaurants.
Enterprises, or local kind-of-activity units (KAUs), with 20 or more employed persons constitute less than 10 per cent of all local KAUs in the hotel and restaurant industry division. Still, they made more than half of the turnover and value added at factor cost. Among these again, hotels contribute most with nearly NOK 5 billion of a total NOK 9 billion in value added at factor cost. On enterprise level their position is fortified further.
Increased turnover in restaurants
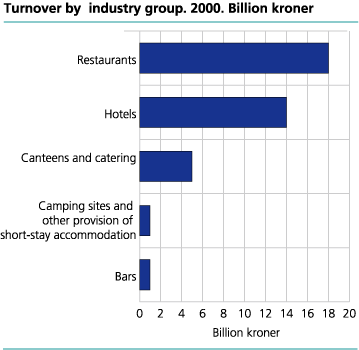
On local KAU level the restaurants - e.g. restaurants, cafés, and snack bars - traded for a good NOK 17.5 billion in 2000. This is an increase of 4 per cent compared with 1999. On average each local KAU had a turnover of slightly less than NOK 2.8 million. This constitutes about 75 per cent of the average for the entire hotel and restaurant industry division. Due to the high number of local KAUs in the restaurant group, this was still the subgroup that was the largest measured in turnover, employment as well as number.
The results only include the local KAUs where the operation of restaurants is the main activity. Subsequently, for instance the sale of fast food in petrol stations are not included here.
Few changes overall
The figures on industry division level, like number of local KAUs, number of employed persons, turnover and value added, hardly changed from 1999 to 2000 on both local KAU level and enterprise level. The largest increase was in the personnel costs. The personnel costs went up by 3.7 per cent for the local KAUs. On average per employed person the personnel costs in 2000 were NOK 157 000 . The greatest decrease was in the investments. The investments went down by 6.6 per cent to NOK 1.5 billion .
The 1999 figures do differ from those previously published due to changes in the register-based data used.
Local KAUs and enterprises
The figures on the enterprise level may differ from those on local KAU level. This is due to some enterprises being registered in one industry subclass after main activity, but also consisting of local KAUs in other subgroups.
More about this and other definitions can be found in the "About the statistics".
Tables:
- Table 1 Hotels and restaurants. Main figures, by industry subclass. Local kind-of-activity units. 1999 and 2000
- Table 2 Hotels and restaurants. Main figures, by industry subclass and number of persons employed. Local kind-of-activity units. 2000
- Table 3 Hotels and restaurant. Main figures, by industry subclass. Enterprises. 1999 and 2000
- Table 4 Hotels and restaurants. Main figures, by industry subclass and number of persons employed. Enterprises. 2000
The statistics is now published as Business statistics.
Contact
-
Statistics Norway's Information Centre
E-mail: informasjon@ssb.no
tel.: (+47) 21 09 46 42


