Highest mileage in Oslo and Akershus
Published:
Every fifth kilometre driven by vans and small lorries was in Oslo and Akershus. A third of goods are transported within and between the two counties. Forty per cent of all deliveries were performed in Oslo and Akershus.
- Full set of figures
- Transport by vans and small lorries
- Series archive
- Transport by vans and small lorries (archive)
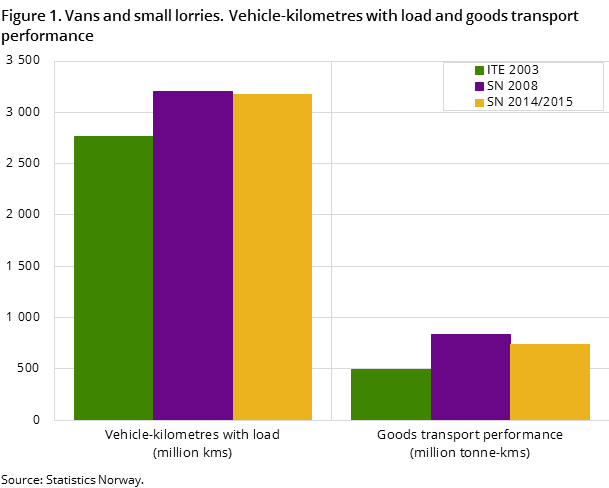
In 2014/2015, vans and small lorries drove a total of 7.4 billion kilometres, of which 3.2 billion were with cargo. The mileage was highest in Oslo and Akershus, followed by Hordaland and Rogaland. The figures show a total of 919 million vehicle kilometres in Akershus, 704 in Oslo, 613 in Rogaland and 574 in Hordaland. The survey also gives figures for 14 selected urban areas. About 30 per cent of the kilometres were driven in these areas.
Small lorries performed a total of 94 million laden journeys and 173 million deliveries. Rogaland, Oslo and Akershus all had about ten million laden journeys. With a total of about 74 million deliveries in Oslo and Akershus, over 40 per cent of all deliveries were carried out in these two counties.
Widely used as service vehicle
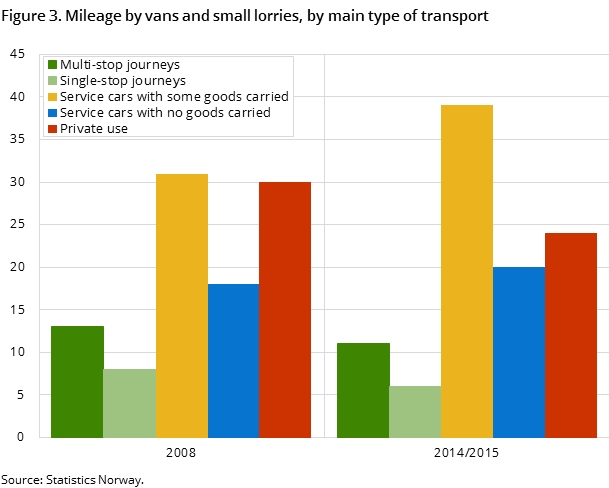
The survey shows that vans and small lorries were commonly used as service vehicles in 2014/2015. Service vehicles carried out 59 per cent of the mileage. In 2008, the corresponding proportion was 49 per cent. In 2014/2015, 24 per cent of the mileage was related to private purposes compared to 30 per cent in 2008. Multi-stop journeys accounted for 11 per cent of mileage, while single-stop journeys accounted for 6 per cent. In 2008, multi-stop journeys accounted for 13 per cent and single-stop journeys for 8 per cent of the mileage.
Building products transported the most
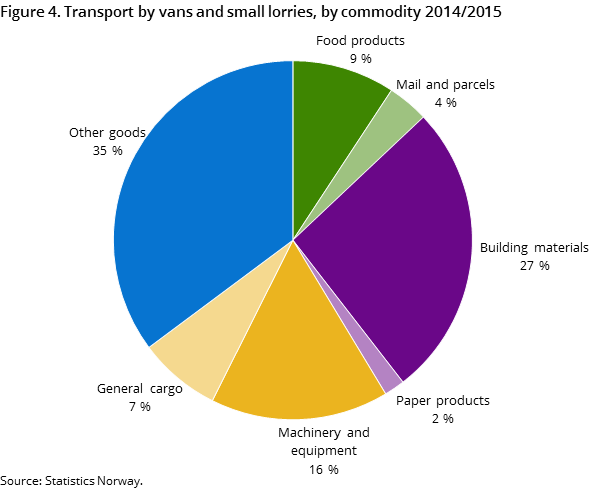
Building products accounted for 27 per cent of the quantity of goods transported by vans and small lorries in 2014/2015, while machinery and equipment accounted for 16 per cent. Food products accounted for 9 per cent of the goods, general cargo 7 per cent, mail and packages 4 per cent and paper products 2 per cent. Thirty-five per cent of tonnage belonged to the category other types of goods. In 2008, the division of types of commodities was somewhat different. In that year, machinery and equipment amounted to 21 per cent, food products 7 per cent, mail and packages 4 per cent and paper products 4 per cent.
Small vans dominate
Small vans and combined vehicles with a carrying capacity of less than one tonne are the main vehicle types among light goods vehicles. Three out of 4 of the small vehicles belong to this group. This vehicle type performed 74 per cent of the mileage and 67 per cent of laden journeys. They accounted for 55 per cent of tonnage carried, 55 per cent of the goods transport performance, 69 per cent of the trips and 32 per cent of deliveries.
Unchanged traffic work, decrease in transport work
Vans and small lorries drove 3.2 billion kilometres with 16 million tonnes of cargo spread over 94 million laden journeys in 2014/2015. The corresponding figure for 2008 is 3.2 billion kilometres with 18 million tonnes of cargo spread over 98 million laden journeys. The survey for 2014/2015 also estimated the number of deliveries at 173 million. The total transport work declined 12 per cent to around 740 million tonne-kilometres compared to 2008. The decline is partly due to fewer small lorries and combined vehicles. The goods transport performance in 2014/2015 was almost 50 per cent higher compared to a similar survey conducted by the Norwegian Institute of Transport Economics (ITE) in 2003.
Vans and small lorries account for small proportion of total road goods transport
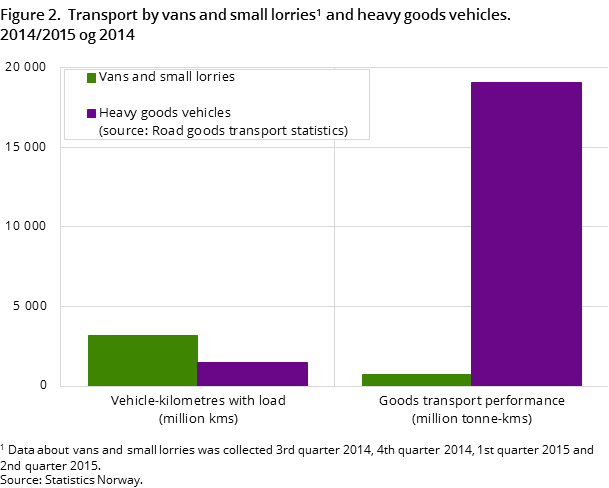
Comparisons with the survey of Road goods transport by Norwegian lorries by Statistics Norway show that vans and small lorries had twice as much mileage as large lorries. There are also about ten times more vans and small lorries than large lorries. However, the tonnage carried by vans and small lorries amounted to only 6 per cent of the total tonnage transported by Norwegian road goods vehicles. The proportion of vans and small lorries of the total road goods transport performance was four per cent.
Contact
-
Geir Martin Pilskog
-
Asbjørn Willy Wethal
-
Statistics Norway's Information Centre


