Content
Published:
This is an archived release.
Largest R&D growth in ICT, oil and gas
Norwegian enterprises performed R&D for NOK 22.6 billion in 2013. There has been an annual increase of 6,8 per cent since 2012. The growth from 2012 has been especially large within ICT, oil and gas.
| 2013 | 2012 - 2013 | ||
|---|---|---|---|
| Level | Percentages | Change in per cent | |
| Intramural R&D expenditure (NOK million) | 22 610.1 | 100 | 6.8 |
| Industry | |||
| Manufacturing | 8 319.4 | 37 | 3.1 |
| Services total | 11 506.0 | 51 | 5.9 |
| Extraction of crude petroleum and natural gas | 2 026.6 | 9 | 28.2 |
| Other industries | 758.1 | 3 | 13.7 |
| Size of enterprise | |||
| 10-49 persons employed | 5 469.8 | 24 | 7.6 |
| 50-99 persons employed | 2 665.8 | 12 | 15.2 |
| 100-199 persons employed | 2 558.0 | 11 | -11.7 |
| 200-499 persons employed | 1 958.3 | 9 | -7.1 |
| 500 persons employed and more | 9 958.1 | 44 | 13.5 |
| R&D man-years (number of) | 16 414 | 2.2 | |
| Extramural R&D expenditure (NOK million) | 6 132.5 | 3.3 | |


The total number of employees involved in R&D in the business sector has increased several years in a row. In 2013, the figure was 25 407, which is a 19 per cent increase from 2007 and a 3 per cent increase from 2012. The presence of foreign R&D personnel with higher education has also been growing. In 2007, these personnel represented 8 per cent of the total R&D workforce with higher education, while the current share is 15 per cent.
A total of 16 414 R&D man-years were performed by the R&D personnel, which is 2 per cent more than in 2012. This means that every person involved in R&D activities carried out on average 0.65 R&D man-years; the same ratio as in 2012. On average, smaller enterprises perform fewer R&D man-years per person than larger enterprises. Among enterprises with 10-19 employees, 0.55 R&D man-years were carried out per person, while enterprises with at least 500 employees had 0.75 R&D man-years per person.
The personnel cost per man-year has increased by 2 per cent from 2012. This cost has varied according to enterprise size and was NOK 766 000 per man-years for enterprises with 10-19 employees, going up to NOK 983 000 per man-year for enterprises with at least 500 employees.
Total R&D costs differ very little from the preliminary figures published in October 2014, although performed man-years have been adjusted slightly downwards. The survey covers enterprises with at least 10 employees.
High R&D figures among ICT and extraction of crude petroleum and natural gas
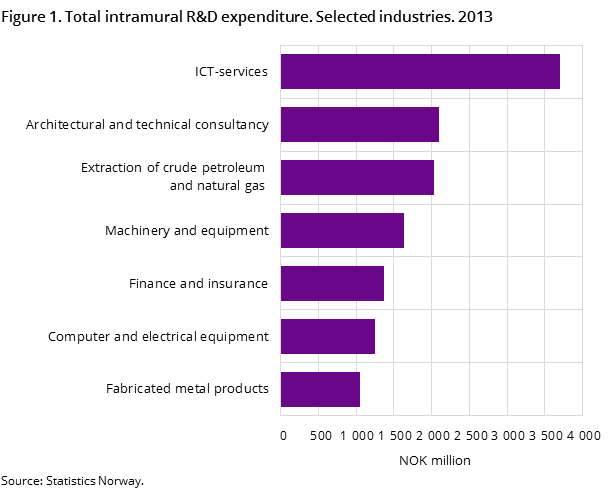
Of the total NOK 22.6 billion spent by business enterprises on intramural R&D in 2013, the manufacturing sector accounted for 37 per cent, while the corresponding share for service industries was 51 per cent. In addition, “other industries” contributed, including extraction of crude petroleum and natural gas, with 12 per cent. Manufacturing industries were the highest spenders in R&D until 2007. Since then, the service industry has shown a steadily increasing share of the total R&D expenditure.
Among industries with high R&D costs were ICT services, which spent NOK 3.7 billion; an increase of 19 per cent from 2012. This industry accounted for 16 per cent of the total R&D expenditure in business enterprises in 2013. Meanwhile, extraction of petroleum and gas totalled NOK 2 billion, which is 28 per cent more than in the previous year. Enterprises with at least 500 employees accounted for 44 per cent of the total intramural R&D expenditure. In contrast, enterprises with 10-19 employees accounted for 11 per cent.
External R&D resources used if needed
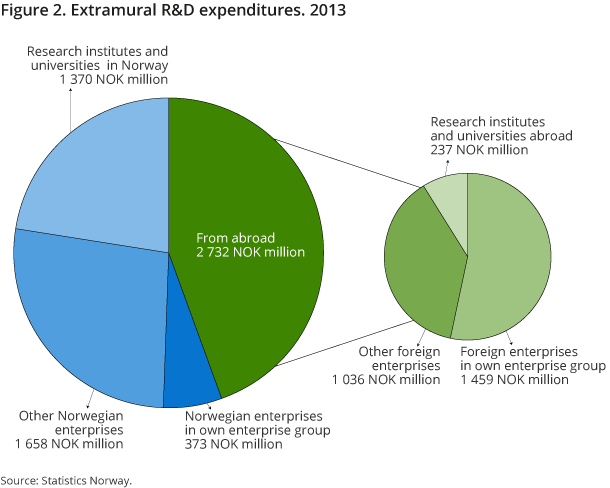
Enterprises also use external resources to perform R&D activities. External R&D personnel are hired or R&D services are procured from other suppliers. Both the enterprises that perform and do not perform their own R&D order and purchase R&D services from others. Despite intramural R&D showing the greatest growth, the total spending on extramural R&D was NOK 6.1 billion in 2013.This was 3.3 per cent higher than in 2012. The majority of R&D services were procured in Norway, while 44 per cent were supplied from abroad.
Other Norwegian enterprises in the business sector are the largest suppliers of R&D services, with a total of NOK 1.7 billion. Another strong supplier is the Norwegian academic sector. Enterprises procured R&D services from research institutes, universities and university colleges for NOK 1.4 billion. This was 13 per cent more than in 2012. The majority of the industries in the business enterprise sector reported procurements from the academic sector.
R&D services supplied by other countries are mostly from the enterprises’ own group abroad. Procurements from this source totalled NOK 1.5 billion and the largest buyer was the extraction of crude petroleum and natural gas industry.
Figures showed that the cost for hired R&D personnel has increased in line with the cost of internal R&D employees in recent years. The total cost for hiring R&D personnel was NOK 1.8 billion; an increase of 4.2 per cent from 2012.
According to the results, the industries within the service sector rely more on hired R&D personnel than those in the manufacturing sector. Service industries committed 11 per cent of their R&D current costs to bring in external R&D personnel. This cost accounted for 6 per cent within manufacturing and 5 per cent among “other industries”. Industries that spend the most on hired R&D personnel were finance and insurance, ICT services and machinery and equipment.
More R&D collaboration with others
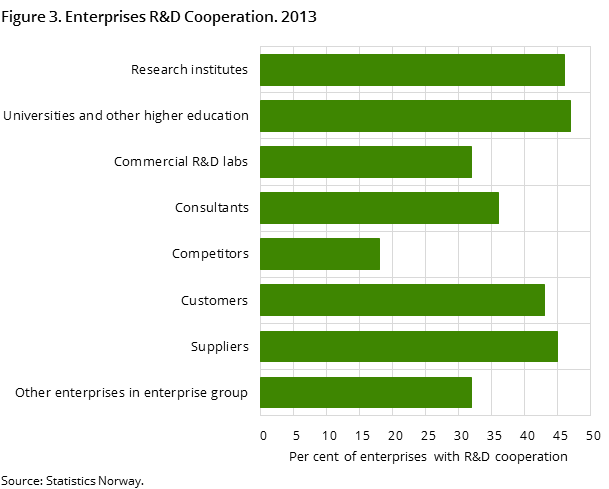
Approximately 32 per cent of all enterprises performing R&D collaborate with other enterprises or institutions when engaging in R&D activities. Universities and university colleges were the most common cooperation partners, and were the primary collaborating partner for 47 per cent of these enterprises. Research institutes were a close second, with 46 per cent. Enterprises in the manufacturing sector are most likely to cooperate with a supplier. On the other hand, the least probable form of cooperation would be with a competitor. This applies to both manufacturing and the service sector; while “other industries” are least likely to collaborate with another enterprise in its own enterprise group.
Mostly internal funding of R&D
Enterprises reported that most of the intramural R&D expenditure is financed by the enterprises’ own funds. This funding accounted for 75 per cent of total funding. In addition, some R&D is funded by an enterprise’s own enterprise group. About 12 per cent of the total funding is provided by foreign enterprises within their own enterprise group. The figure for funding by Norwegian enterprises in their own enterprise group was much lower, at 2 per cent. Meanwhile, 4 per cent was covered by public funds.
Higher costs for product-related R&D
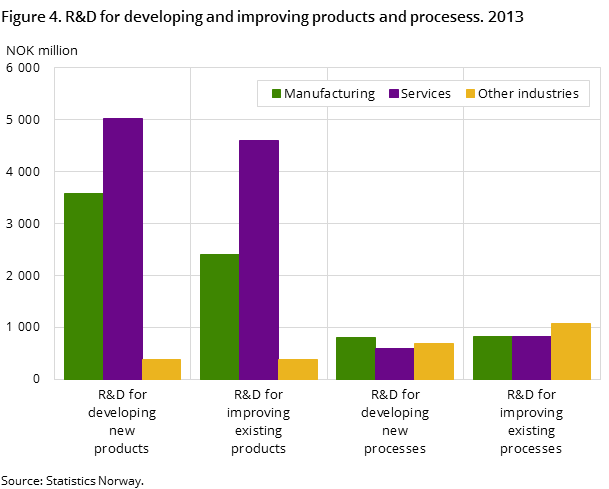
Around 42 per cent of the total R&D current costs went into the development of new products, while 35 per cent was used to improve existing products. At the same time, 13 per cent of the cost was spent on improving processes and 10 per cent on developing new processes. Both the manufacturing and the service industry sector allocated most of their spending to the development and improvement of products. Together, both main industries invested NOK 8.6 billion in new product development and NOK 7 billion in product improvement. Conversely, “other industries” spent most of its costs on processes. Roughly NOK 1.1 billion went to improving their processes and NOK 700 million to develop new processes.
Uncertainty of the resultsOpen and readClose
R&D statistics are based on information collected from the enterprises. All enterprises with 50 employees or more are included. In addition, a sample of enterprises with 10-49 employees is drawn and total figures for this group are calculated based on this sample. As a result, there is greater uncertainty surrounding the results for the small enterprises.
Enterprises with 5-9 employeesOpen and readClose
Enterprises with 5-9 employees are included every second year. Due to yearly and international comparisons, the figures for the business enterprise sector cover enterprises with at least 10 employees, unless otherwise stated.
Find more figures
Find detailed figures for Research and development in the business enterprise sector
Contact
-
Kristine Langhoff
E-mail: kristine.langhoff@ssb.no
tel.: (+47) 40 90 24 39
-
Claudia Berrios
E-mail: claudia.berrios@ssb.no
tel.: (+47) 40 90 24 51
-
Harald Fondevik
E-mail: harald.fondevik@ssb.no
tel.: (+47) 40 90 24 47
