Content
Published:
This is an archived release.
Increased net financial assets
General government net financial assets at the end of 2003 amounted to NOK 1 308 billion, an increase of 20.8 per cent from 2002. At the end of 2003, general governments total financial assets had increased by 20.6 per cent and amounted to NOK 2 284 billion, and total liabilities had increased by 20.3 per cent and amounted nearly to NOK 976 billion.
The growth in general government net financial assets is primarily caused by increased financial assets in central government. This is a result of large allocations to the Government Petroleum Fund and high yields during the year. This is expressed through the increase in net financial assets in other central government accounts, which was NOK 249 billion in 2003.
However, net financial assets in the central government fiscal accounts including the National Insurance Scheme decreased from NOK 193.2 billion in 2002 to NOK 190.3 billion in 2003.
According to local government assets and liabilities, net financial debt increased by NOK 16 billion in 2003. The significant deficit in net lending contributed to this. The local government financial balance for 2002 has been revised, and the new balance sheet indicates a decrease in net financial debt of NOK 12 billion in 2002. The figures are affected by the takeover of responsibility for all Norwegian hospitals by the central government from 1 January 2002. The local government received sizeable grants from central government in connection with this takeover.
Gross public debt
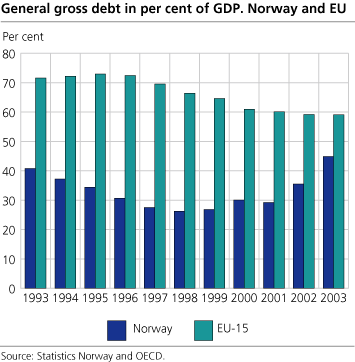
The Maastricht Treaty definition is usually used in international comparisons of gross public debt. The definition does not include internal accounts payable and liabilities in general government. According to this delimitation, Norway's public debt was 44.9 per cent of gross domestic product (GDP) at the end of 2003. Average for the 15 EU member countries at the end of 2003 was 59.1 per cent, according to figures from the OECD.
|
General government. Financial balance sheet.
Nominal value. NOK billion and change in per cent |
| NOK billion |
Change in
per cent |
||||||||||||||||||||||||||||||||||||||
|---|---|---|---|---|---|---|---|---|---|---|---|---|---|---|---|---|---|---|---|---|---|---|---|---|---|---|---|---|---|---|---|---|---|---|---|---|---|---|---|
| 2002 | 2003 | ||||||||||||||||||||||||||||||||||||||
| A. Financial assets, total | 1 894.5 | 2 284.3 | 20.6 | ||||||||||||||||||||||||||||||||||||
| Cash and deposits | 148.5 | 215.0 | 44.8 | ||||||||||||||||||||||||||||||||||||
| Commercial papers and bonds | 448.3 | 535.5 | 19.5 | ||||||||||||||||||||||||||||||||||||
| Other loans | 605.5 | 716.2 | 18.3 | ||||||||||||||||||||||||||||||||||||
| Capital deposits and shares | 488.0 | 627.1 | 28.5 | ||||||||||||||||||||||||||||||||||||
| Other financial assets | 202.5 | 188.8 | -6.8 | ||||||||||||||||||||||||||||||||||||
| B. Liabilities, total | 811.7 | 976.1 | 20.3 | ||||||||||||||||||||||||||||||||||||
| Commercial papers and Treasury bills | 56.4 | 74.1 | 31.4 | ||||||||||||||||||||||||||||||||||||
| Bonds | 152.5 | 183.3 | 20.2 | ||||||||||||||||||||||||||||||||||||
| Other loans | 503.7 | 612.9 | 21.7 | ||||||||||||||||||||||||||||||||||||
| Other liabilities | 98.9 | 105.5 | 6.7 | ||||||||||||||||||||||||||||||||||||
| C. Net financial assets (A-B) | 1 082.8 | 1 308.2 | 20.8 | ||||||||||||||||||||||||||||||||||||
| General gross debt | 548.8 | 700.8 | 27.7 | ||||||||||||||||||||||||||||||||||||
| Per cent of GDP | 36.1 | 44.9 | 24.4 | ||||||||||||||||||||||||||||||||||||
This page has been discontinued, see General government, financial assets and liabilities, Quarterly.
Additional information
Contact
-
Jostein Birkelund
E-mail: jostein.birkelund@ssb.no
tel.: (+47) 40 90 26 55
-
Achraf Bougroug
E-mail: achraf.bougroug@ssb.no
tel.: (+47) 40 90 26 15
-
Frode Borgås
E-mail: frode.borgas@ssb.no
tel.: (+47) 40 90 26 52

