Content
Published:
This is an archived release.
Over 1 million examined and treated in public dental care
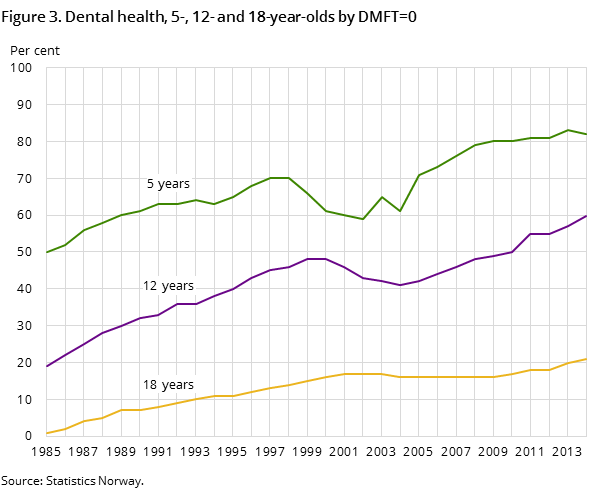
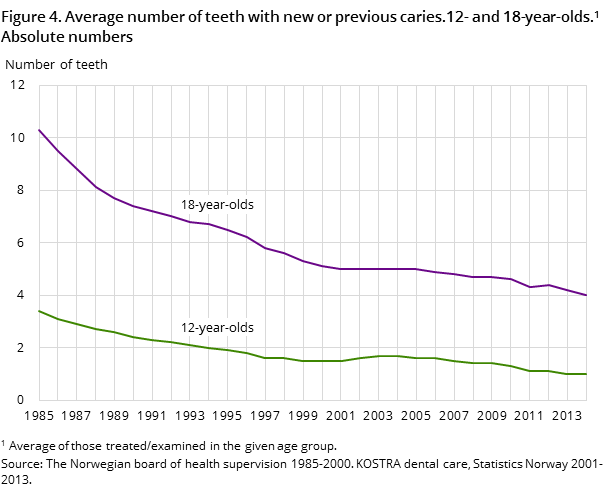
Over 1 million persons were examined and treated in the public dental services in 2014. Dental health of children and adolescents appears to have been strengthened further. A total of NOK 3.3 billion was spent on dental health in counties in 2014.
| 2014 | Percentage change | ||
|---|---|---|---|
| Absolute figures | 2013 - 2014 | 2010 - 2014 | |
| Dental health status | |||
| Average number of teeth with caries experience per 12-year-old | 1.0 | 0.0 | -23.1 |
| Average number of teeth with caries experience per 18-year-old | 4.0 | -4.8 | -13.0 |
| SIC-index for 12-year-olds | 2.7 | -6.9 | -18.2 |
| Man-years | |||
| Settled dentist man-years (public and private) | 4 053.9 | 1.2 | 9.6 |
| Settled dental hygienist man-years (public and private) | 883.20 | 2.7 | 14.1 |
| dental specialists (public and private) | 469 | 4.9 | 21.4 |
| Activity | |||
| Prioritised persons examined/treated | 868 032 | 1.9 | 5.0 |
| Children and youth 3-18 years old, examined/treated | 717 864 | 2.8 | 4.5 |
| Elderly, long term ill or disabled in home nursing, examined/treated | 33 673 | -2.5 | 14.9 |
| Elderly, long term ill or disabled in institution, examined/treated | 32 416 | -3.1 | 1.7 |
| Paying adult clients, examined/treated | 203 124 | 3.6 | 18.5 |
| 2014 | Percentage change | ||
| NOK 1000 | 2013 - 2014 | 2010 - 2014 | |
| Expenditures | |||
| Gross operating expenditures, dental health care | 3 290 809 | 7.0 | 19.7 |
| Gross operating expenditures, treatments of patients | 2 539 118 | 6.9 | 15.7 |
| Gross operating expenditures, joint functions | 751 691 | 7.3 | 35.6 |


Increase in expenditure
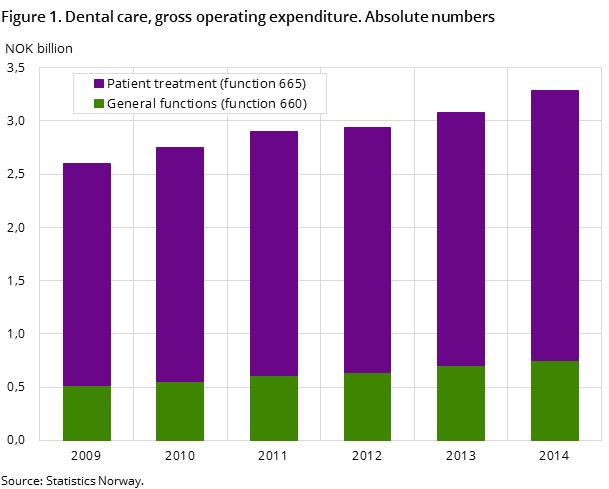
Public dental care in Norway is the responsibility of the county authorities. In 2014, measured by gross operating expenditure, the counties spent a total of NOK 3.3 billion on public dental care, which corresponds to a 7 per cent increase in expenditure from 2013. By comparison, the increase in expenditure was approximately 20 per cent from 2010 to 2014.
The largest amount of expenditure in public dental care is related to patient treatment, but the greatest increase was in the expenditure that is not directly dependent on patient treatment. In 2014, the counties spent over NOK 2.5 billion on employees, materials and services directly related to patient treatment, which is an increase of 7 per cent from 2013 and 16 per cent from 2010. With regard to expenditure not directly related to patient treatment, such as premises, equipment and rent/administration, these totalled NOK 750 million in 2014. This represents an increase of 7 per cent from 2013.
More man-years in both public and private sector
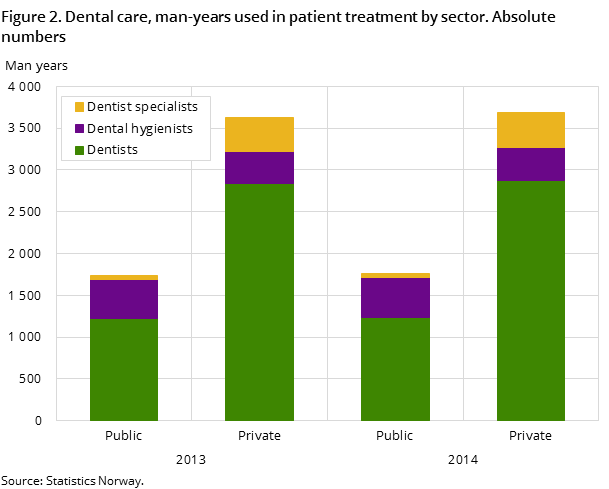
Patient treatment in dental care is mainly carried out by dentists, dental hygienists and dentist specialists. The number of man-years in the public sector is increasing for all these occupations. In 2013 there were 1 231 dentist man-years in the counties, which represents an increase of about 0.5 per cent from 2013 and 7 per cent from 2010. With regard to dental hygienists, the number increased from 469 in 2013 to 480 in 2014; an increase of around 2 per cent, while there were 50 man-years carried out by dentist specialists in 2014, which is an increase of four man-years from2013.
The private dental care sector carries out services to a somewhat different population and has a different assignment to the public sector. In 2014, there were a total of 3 293 dentist man-years in the private sector, which represents an increase of 2 per cent from 2013. The situation is similar for dental hygienists. In 2014, there were 404 dental hygienist man-years carried out, which is an increase of 3 per cent from 2013. With regard to dentist specialists, the number of man-years in the private sector totalled 419 in 2014; a 4.4 per cent increase from 2013.
Man-years in the public and private sectors combined show an increase in the total coverage of dentists, dental hygienists and dentist specialists respectively from 2013 to 2014. In 2014, there were 0.88 man-years per 1 000 inhabitants in the public and private sectors in total, which means that the coverage of dentists has increased from 2013 to 2014. For dental hygienists, the developments in coverage are pretty much the same. In 2014, there were 0.17 man-years per inhabitant, while the coverage was the same in 2013.
For dentist specialists, the coverage has increased even more than the coverage of dentists and dental hygienists from 2013 to 2014. In 2014, there were 0.09 man-years per 1 000 inhabitants, while the coverage was 0.08 man-years per 1 000 inhabitants in 2013. Moreover, the numbers show that there are differences in coverage from one county to another for all the three occupations.
Both priority patients and paying adults who have been examined in the public dental services are increasing
The public dental service is primarily intended to provide dental services to the parts of the population that are prioritised through dental health legislation. This includes for example, children and youths, mentally disabled persons and groups of elderly, long-term sick or disabled in institutions and at home. Overall, approximately 1.06 million persons were examined and treated in the public dental service in 2014. About 8 out of 10 of all those examined and treated were in prioritised groups.
During the last five-year period from 2010 to 2014, the share of patients in priority groups who have been examined and treated has been stable, at just over 60 per cent. Approximately 870 000 patients from priority groups were examined and treated in 2014, which is an increase of 2 per cent from 2013. For the last five years from 2010 to 2014, the increase was 5 per cent.
Contact
-
Trond Ekornrud
E-mail: trond.ekornrud@ssb.no
tel.: (+47) 48 13 70 09
