Content
Published:
This is an archived release.
Substantial decrease in value for goods manufactured
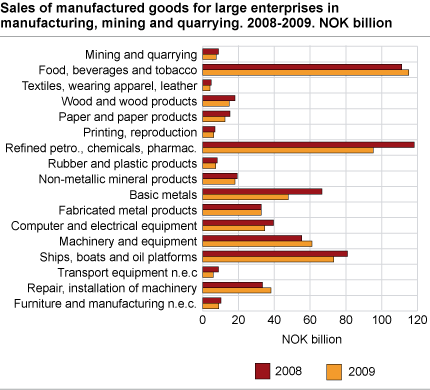
Sales of goods manufactured decreased by 8.6 per cent in 2009, which is the first observed decline since 2003. The downturn varied between different industries and in terms of value the decline was largest in the refined petroleum, chemicals and pharmaceutical industry.
Several industries had a large decline in value of goods manufactured in 2009. With transport equipment n.e.c having the largest decline, of 33.1 per cent. Basic metals were down 28.4 per cent on the year. A total of eight industries were down between 10 and 20 per cent in 2009. These reduced the total value for goods manufactured by NOK 36.8 billion of the total NOK 55 billion reported. The monthly turnover statistics ( see Turnover statistics ) for manufacturing, mining and quarrying showed a decrease of 7.4 per cent in 2009, with a comparable development for the various industries as in the manufacturing statistics.
A large part of the decline in value of goods manufactured was due to enterprises that no longer were producing in 2009. These contributed a decline of NOK 17.6 billion. New enterprises contributed NOK 6.8 billion to value for goods manufactured.
Repair, installation of machinery had the largest increase in value of goods manufactured; 14.4 per cent higher than in 2008. This upturn has to be seen in comparison with ships, boats and oil platforms, which had a decrease in value of goods manufactured of 9.5 per cent. As the manufacturing statistics are commodity statistics, where each enterprise is asked to give turnover figures on several production codes, some of this production will inevitably be reported on codes that are in other industries than the enterprise is classified under. This is especially evident in ships, boats and oil platforms, where NOK 4.3 billion of value for goods manufactured was reported on production codes in repair, installation of machinery.
Another industry with a good 2009 was machinery and equipment, which increased its value for goods manufactured by 10.5 per cent, and thus became the third largest industry in manufacturing, mining and quarrying.
Food, beverages and tobacco back on top
Manufacturing, mining and quarrying showed a total of NOK 583 billion in value for goods manufactured in 2009. With NOK 115 billion, food, beverages and tobacco was the largest industry. After a decline of NOK 22.5 billion, refined petroleum, chemicals and pharmaceutical industry were surpassed as the largest contributor to value for goods manufactured. Food, beverages and tobacco has traditionally been more stable, with other industries being more exposed to movements in prices.
|
Manufacturing statistics are based on information from the largest 2 275 enterprises classified in manufacturing, mining and quarrying. These enterprises had a share of roughly 90 per cent of total manufacturing in 2008. These statistics are published yearly in agreement with Eurostat and the data is also used in the national accounts. |
Tables:
Find more figures
Find detailed figures from Production of commodities in manufacturing, mining and quarrying
Contact
-
Elisabeth Helgeberg
E-mail: elisabeth.helgeberg@ssb.no
tel.: (+47) 92 81 98 88
-
Samuel Abonyo
E-mail: samuel.abonyo@ssb.no
tel.: (+47) 40 81 14 95

