Content
Published:
This is an archived release.
Value for goods manufactured, slightly up
Sales of goods manufactured rose by 3.7 per cent in 2010. Manufacturing, mining and quarrying showed a total of NOK 603 billion in value for goods manufactured in 2010.
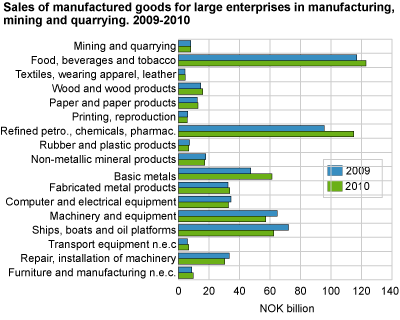
The basic metals industry showed the best 2010, with an increase of almost 30 per cent. This must be seen in context with the dismal figures of 2009. Basic metals have almost come back to the levels observed in 2008, and are only 9 per cent lower. Refined petroleum, chemicals and pharmaceutical industry had growth of 20 per cent, or NOK 20 billion in 2010. This is mostly due to the 20 per cent higher prices for refined petroleum, (see Producer price index ).
Machinery and equipment fell back form record highs in 2009, with a decrease of 16.9 per cent. This is due to the historic high level of orders into 2009; which meant they could continue to produce throughout 2009. The downturn in new orders observed in 2009 first had effect on the industry in 2010 (see Statistics on new orders ). Ships, boats and oil platforms continued downwards in 2010, with a decrease of NOK 9.7 billion or 13.5 per cent.
Food, beverages and tobacco back on top
With NOK 122 billion, food, beverages and tobacco was the largest industry in 2010. After an increase of NOK 19.5 billion, refined petroleum, chemicals and pharmaceutical industry had a good 2010, but not enough to take back the mantle of largest industry they had in 2008. Food, beverages and tobacco has traditionally been more stable, with other industries being more exposed to movements in prices.
|
Manufacturing statistics are based on information from the largest 2 214 enterprises classified in manufacturing, mining and quarrying. These enterprises had a share of roughly 92 per cent of total manufacturing in 2009. These statistics are published yearly in agreement with Eurostat and the data is also used in the national accounts. The figures in this statistic are from commodity data, which in turn are aggregated up to industry statistics. As a result, much of the increase in repair, installation of machinery were due to activity outside this industry. |
Tables:
Find more figures
Find detailed figures from Production of commodities in manufacturing, mining and quarrying
Contact
-
Elisabeth Helgeberg
E-mail: elisabeth.helgeberg@ssb.no
tel.: (+47) 92 81 98 88
-
Samuel Abonyo
E-mail: samuel.abonyo@ssb.no
tel.: (+47) 40 81 14 95