Content
Published:
This is an archived release.
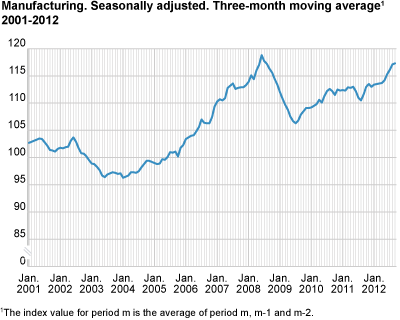
Growth in manufacturing
Production in manufacturing increased by 1.7 per cent from the second to the third quarter of 2012, according to seasonally-adjusted figures.
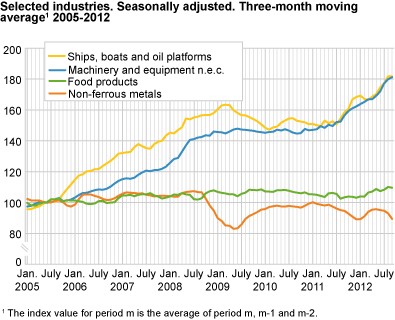
Industries such as machinery and equipment, and ships, boats and oil platforms had a continued production growth in this period. This can be related to a strong increase in new orders in the second quarter for these industries (see statistics for new orders) , and a significant growth in employment during the third quarter (see business tendency survey ).
The output within machinery and equipment, and ships, boats and oil platforms was thus at a record high level in the third quarter of 2012, with a volume growth of over 80 per cent since 2005. Furthermore, production in food products also went up by 2.0 per cent from the second to the third quarter of 2012. The industry maintained positive figures, despite a production drop from August to September 2012, which was due to lower output of meat and meat products.
High production growth of farmed salmon from the second to the third quarter is the key factor behind the growth in food products. On the other hand, basic metals had a downturn in production by 6.0 per cent in the same period as a result of a weaker international market and generally low aluminium prices in 2012.
From September 2011 to September 2012
The output in manufacturing saw a growth of 2.4 per cent from September 2011 to September 2012, according to working-day adjusted figures. Industries like machinery and equipment, together with ships, boats and oil platforms had a strong production growth. On the other hand, basic chemicals and non-ferrous metals had a substantial drop in production in the same period..
From August to September 2012
The production in Norwegian manufacturing went down by 0.8 per cent from August to September 2012, according to seasonally-adjusted figures. Basic chemicals and non-ferrous metals had a decrease in production, while ships, boats and oil platforms and repair, installation of machinery saw an increase in production.
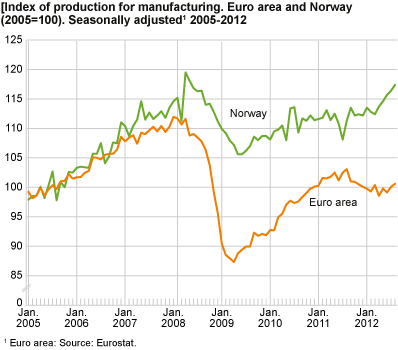
Norway and the euro area
There was a 5.5 per cent increase in Norwegian manufacturing output from August 2011 to August 2012, according to working-day adjusted figures. Industrial production in the euro area decreased by 2.9 per cent in the same period, according to figures published by Eurostat .
| Adjusted for working-days 1 | Seasonally adjusted | ||||||||||||||||||||||||||||||||||||||||||||||||||||||||||||||||||||||||||||||
|---|---|---|---|---|---|---|---|---|---|---|---|---|---|---|---|---|---|---|---|---|---|---|---|---|---|---|---|---|---|---|---|---|---|---|---|---|---|---|---|---|---|---|---|---|---|---|---|---|---|---|---|---|---|---|---|---|---|---|---|---|---|---|---|---|---|---|---|---|---|---|---|---|---|---|---|---|---|---|---|
| September 2011- September 2012 | January 2011-September 2011- January 2012-September 2012 | August 2012- September 2012 | April 2012-June 2012- July 2012-September 2012 | ||||||||||||||||||||||||||||||||||||||||||||||||||||||||||||||||||||||||||||
| The overall index | -5.0 | 3.9 | -5.6 | -4.7 | |||||||||||||||||||||||||||||||||||||||||||||||||||||||||||||||||||||||||||
| Oil and Gas Extraction | -13.5 | 0.7 | -8.5 | -7.3 | |||||||||||||||||||||||||||||||||||||||||||||||||||||||||||||||||||||||||||
| Manufacturing | 2.4 | 2.7 | -0.8 | 1.7 | |||||||||||||||||||||||||||||||||||||||||||||||||||||||||||||||||||||||||||
| Electricity, Gas and Steam Supply | 6.7 | 21.1 | -5.8 | -9.1 | |||||||||||||||||||||||||||||||||||||||||||||||||||||||||||||||||||||||||||
| Main industrial groupings | |||||||||||||||||||||||||||||||||||||||||||||||||||||||||||||||||||||||||||||||
| Intermediate goods | -0.3 | 2.2 | -1.9 | 1.8 | |||||||||||||||||||||||||||||||||||||||||||||||||||||||||||||||||||||||||||
| Capital goods | 9.5 | 9.7 | - | 3.9 | |||||||||||||||||||||||||||||||||||||||||||||||||||||||||||||||||||||||||||
| Consumer goods | 2.9 | 1.0 | -3.2 | 1.3 | |||||||||||||||||||||||||||||||||||||||||||||||||||||||||||||||||||||||||||
| Energy goods | -12.7 | 2.1 | -9.9 | -8.3 | |||||||||||||||||||||||||||||||||||||||||||||||||||||||||||||||||||||||||||
| 1 | Adjusted for working-days and for public holidays in Norway. |
Interpretation of seasonally-adjusted figuresIn order to facilitate the interpretation of the short-term development, the index of production publishes three-month moving averages of the seasonally-adjusted figures. Comparisons are normally made between the latest non-overlapping three-month periods, for instance July to September 2012 compared with April to June 2012. Seasonally-adjusted monthly changes must be interpreted with caution. |
Number of hours workedThe numbers of hours worked by contracted workers was introduced in the calculation of the Index of production in January 2012. These numbers are collected from January 2011. The inclusion of numbers of hours worked by contracted workers may lead to somewhat larger short-term fluctuations for some industries. At the same time, the development will be more accurately measured for industries where hours worked are used as an indicator. Industries like ships, boats and oil platforms and repair and installation of machinery typically use contracted workers in periods with high activity. |
New projectsNew projects in industries with hours worked as an indicator are intercepted at start-up, as long as the project is carried out by establishments covered by the sample. It is the total number of hours carried out in the survey period that is reported, regardless of which project the hours are spent on. |
Tables
Contact
-
Production and turnover
E-mail: prodoms@ssb.no