Content
Published:
This is an archived release.
Strong results for Norwegian banks
Norwegian banks’ profit in the fourth quarter of 2010 amounted to NOK 7.9 billion. This was NOK 3.9 billion higher than the result in the equivalent quarter the previous year. Most of the increase came from lower loan losses, high net interest income and moderate costs.
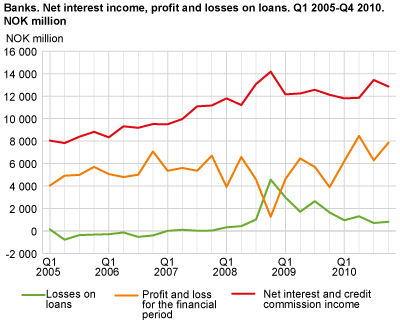
In 2010, Norwegian banks’ accumulated profits were NOK 28.8 billion. For comparison, the accumulated profits were NOK 20.6 billion at the same time last year.
As a percentage of total assets, profit in the fourth quarter 2010 accounted for 0.22 per cent. In the same quarter last year this share was 0.10 per cent. On average, the result as a percentage of total assets has been about 0.17 per cent over the last 10 years.
| Net interest and credit commission income |
Losses on loans |
Net gain on securities and currency |
Profit and loss for the financial period |
Profit and loss as percentage of total assets. Per cent |
|||||||||||||||||||||||||||||||||||||||||||||||||||||||||||||||||||||||||||
|---|---|---|---|---|---|---|---|---|---|---|---|---|---|---|---|---|---|---|---|---|---|---|---|---|---|---|---|---|---|---|---|---|---|---|---|---|---|---|---|---|---|---|---|---|---|---|---|---|---|---|---|---|---|---|---|---|---|---|---|---|---|---|---|---|---|---|---|---|---|---|---|---|---|---|---|---|---|---|---|
| Q3 2003 | 8 222 | 1 651 | 569 | 2 440 | 0.14 | ||||||||||||||||||||||||||||||||||||||||||||||||||||||||||||||||||||||||||
| Q4 2003 | 7 680 | 1 498 | 972 | 3 069 | 0.19 | ||||||||||||||||||||||||||||||||||||||||||||||||||||||||||||||||||||||||||
| Q1 2004 | 7 621 | 474 | 932 | 3 558 | 0.20 | ||||||||||||||||||||||||||||||||||||||||||||||||||||||||||||||||||||||||||
| Q2 2004 | 7 864 | 236 | 629 | 3 367 | 0.18 | ||||||||||||||||||||||||||||||||||||||||||||||||||||||||||||||||||||||||||
| Q3 2004 | 8 433 | 232 | 613 | 4 127 | 0.23 | ||||||||||||||||||||||||||||||||||||||||||||||||||||||||||||||||||||||||||
| Q4 2004 | 8 193 | 222 | 882 | 3 974 | 0.24 | ||||||||||||||||||||||||||||||||||||||||||||||||||||||||||||||||||||||||||
| Q1 2005 | 8 042 | 142 | 892 | 4 036 | 0.21 | ||||||||||||||||||||||||||||||||||||||||||||||||||||||||||||||||||||||||||
| Q2 2005 | 7 822 | -778 | 1 169 | 4 918 | 0.25 | ||||||||||||||||||||||||||||||||||||||||||||||||||||||||||||||||||||||||||
| Q3 2005 | 8 384 | -369 | 1 211 | 4 988 | 0.24 | ||||||||||||||||||||||||||||||||||||||||||||||||||||||||||||||||||||||||||
| Q4 2005 | 8 824 | -324 | 1 240 | 5 700 | 0.28 | ||||||||||||||||||||||||||||||||||||||||||||||||||||||||||||||||||||||||||
| Q1 2006 | 8 333 | -289 | 1 504 | 5 065 | 0.22 | ||||||||||||||||||||||||||||||||||||||||||||||||||||||||||||||||||||||||||
| Q2 2006 | 9 313 | -137 | 283 | 4 799 | 0.20 | ||||||||||||||||||||||||||||||||||||||||||||||||||||||||||||||||||||||||||
| Q3 2006 | 9 181 | -528 | 849 | 5 007 | 0.20 | ||||||||||||||||||||||||||||||||||||||||||||||||||||||||||||||||||||||||||
| Q4 2006 | 9 513 | -399 | 1 597 | 7 076 | 0.27 | ||||||||||||||||||||||||||||||||||||||||||||||||||||||||||||||||||||||||||
| Q1 2007 | 9 498 | 7 | 1 481 | 5 358 | 0.19 | ||||||||||||||||||||||||||||||||||||||||||||||||||||||||||||||||||||||||||
| Q2 2007 | 9 963 | 104 | 1 432 | 5 608 | 0.19 | ||||||||||||||||||||||||||||||||||||||||||||||||||||||||||||||||||||||||||
| Q3 2007 | 11 088 | 21 | 143 | 5 357 | 0.18 | ||||||||||||||||||||||||||||||||||||||||||||||||||||||||||||||||||||||||||
| Q4 2007 | 11 166 | 32 | 576 | 6 698 | 0.23 | ||||||||||||||||||||||||||||||||||||||||||||||||||||||||||||||||||||||||||
| Q1 2008 | 11 801 | 323 | -2 139 | 3 921 | 0.12 | ||||||||||||||||||||||||||||||||||||||||||||||||||||||||||||||||||||||||||
| Q2 2008 | 11 211 | 429 | 2 247 | 6 580 | 0.20 | ||||||||||||||||||||||||||||||||||||||||||||||||||||||||||||||||||||||||||
| Q3 2008 | 13 072 | 1 014 | -168 | 4 587 | 0.13 | ||||||||||||||||||||||||||||||||||||||||||||||||||||||||||||||||||||||||||
| Q4 2008 | 14 177 | 4 569 | -1 454 | 1 260 | 0.03 | ||||||||||||||||||||||||||||||||||||||||||||||||||||||||||||||||||||||||||
| Q1 2009 | 12 158 | 2 982 | 3 284 | 4 623 | 0.13 | ||||||||||||||||||||||||||||||||||||||||||||||||||||||||||||||||||||||||||
| Q2 2009 | 12 239 | 1 711 | 2 557 | 6 451 | 0.17 | ||||||||||||||||||||||||||||||||||||||||||||||||||||||||||||||||||||||||||
| Q3 2009 | 12 563 | 2 648 | 3 020 | 5 698 | 0.15 | ||||||||||||||||||||||||||||||||||||||||||||||||||||||||||||||||||||||||||
| Q4 2009 | 12 228 | 1 644 | 1 571 | 3 862 | 0.10 | ||||||||||||||||||||||||||||||||||||||||||||||||||||||||||||||||||||||||||
| Q1 2010 | 11 800 | 951 | 1 416 | 6 213 | 0.17 | ||||||||||||||||||||||||||||||||||||||||||||||||||||||||||||||||||||||||||
| Q2 2010 | 11 852 | 1 306 | -511 | 8 462 | 0.22 | ||||||||||||||||||||||||||||||||||||||||||||||||||||||||||||||||||||||||||
| Q3 2010 | 13 436 | 708 | 2 413 | 6 290 | 0.17 | ||||||||||||||||||||||||||||||||||||||||||||||||||||||||||||||||||||||||||
| Q4 2010 | 12 856 | 815 | 1 167 | 7 857 | 0.22 | ||||||||||||||||||||||||||||||||||||||||||||||||||||||||||||||||||||||||||
Lower loan losses
Norwegian banks’ loan losses in the fourth quarter of 2010 were NOK 815 million; a moderate rise from NOK 708 million in the previous quarter. In the same quarter last year the loan losses were 1.6 billion. To find lower loan losses we need to go back to the second quarter of 2008.
High, stable net interest income
Norwegian banks’ interest income increased strongly in the fourth quarter to NOK 53.2 billion and 40.4 billion respectively. The net interest income fell moderately from NOK 13.4 billion to 12.9 billion from the third to fourth quarter of 2010. With the exception of the third quarter of 2010, we will not find higher net interest income since the fourth quarter of 2008.
As a percentage of total assets, the net interest income accounted for 0.35 per cent in the fourth quarter of 2010. This share has been stable between 0.32 and 0.38 per cent the last 5 years.
Lower gains on securities and currency
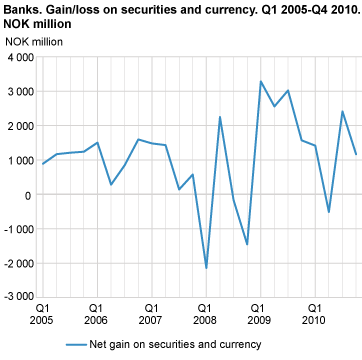
Norwegian banks’ total gains on securities and currency amounted to NOK 1.2 billion in the fourth quarter of 2010. In the third quarter, the gain was NOK 2.4 billion. The accumulated gain on securities and currency in 2010 was NOK 4.5 billion, whereas the accumulated gain in 2009 was NOK 10.4 billon.
In 2010, the net gain on currency amounted to NOK 3.6 billion. The gain fell from NOK 7.1 billion in 2009.
Good results also in mortgage companies
Mortgage companies’ profits in the fourth quarter of 2010 rose to NOK 2.2 billion. As a percentage of total assets, profits accounted for 0.15 per cent, up from 0.06 per cent in the previous quarter.
In 2010, the accumulated profits in mortgage companies were NOK 5.4 billion; a rise from NOK 2.1 billion the previous year.
Net losses on currency of NOK 7.1 billion in 2010 were more than offset by a net gain on other financial instruments of NOK 7.9 billion. Loan losses in 2010 were only NOK 138 million, down from NOK 231 million in 2009.
The net interest income in 2010 was NOK 8.2 billion; almost the same level as in 2009. The level of net interest income has been high in all quarters in 2010.
Profits in finance companies in 2010 at same high level as in 2009
Profits in Norwegian finance companies in 2010 were NOK 2.0 billion; almost as high as in 2009. Net interest income fell substantially from NOK 7.4 billion in 2009 to NOK 5.6 billion in 2010. Net provision income was however stable in both years at NOK 1.3 billion. Loan losses in finance companies fell sharply to NOK 821 million in 2010.
In the third quarter of 2010 there was a merger between a finance company and a bank. Comparisons of the results before and after the merger are therefore difficult for the finance companies.
Tables
The statistics is now published as Banks and mortgage companies.
Contact
-
Statistics Norway's Information Centre
E-mail: informasjon@ssb.no
tel.: (+47) 21 09 46 42