Release of Index of household consumption of goods has been suspended until further notice.
Statistikk innhold
Statistics on
Index of household consumption of goods
The index of household consumption of goods measures the development in household consumption of goods (durable and non-durable). The statistics are calculated as an index and are based on the index of wholesale and retail sales, first-time registered motor vehicles, sales of alcoholic and non-alcoholic beverages and electricity, petrol and fuel statistics. The index does not cover household consumption of goods abroad.
Selected figures from these statistics
- Index of household consumption of goods. Main table. Percentage volume change from the previous month. Seasonally adjusted. 2005=100Download table as ...Index of household consumption of goods. Main table. Percentage volume change from the previous month. Seasonally adjusted. 2005=100
February 2025 March 2025 April 2025 May 2025 June 2025 Total 0.8 0.0 0.9 0.5 1.3 Food, beverages and tobacco 0.5 -0.8 0.8 -0.2 -0.7 Electricity and heating fuels 1.8 -2.0 -4.1 4.0 8.9 Purchases of vehicles and petrol 3.3 -0.8 3.3 1.7 3.6 Other goods -0.2 1.3 1.0 -0.3 -0.1 Explanation of symbolsDownload table as ... - Index of household consumption of goods. Volume index. Unadjusted. 2005=100Download table as ...Index of household consumption of goods. Volume index. Unadjusted. 2005=100
Total Food, beverages and tobacco Electricity and heating fuels Purchases of vehicles and petrol Other goods July 2023 128.6 121.3 60.6 118.7 159.5 August 2023 137.6 126.0 66.7 136.0 168.9 September 2023 129.8 120.0 75.5 126.4 155.0 October 2023 132.9 119.3 118.3 116.0 155.1 November 2023 151.4 122.8 151.8 121.8 189.0 December 2023 167.1 147.8 183.5 124.1 197.0 January 2024 128.1 109.5 193.8 86.6 141.1 February 2024 126.9 114.0 160.5 102.5 136.2 March 2024 137.3 133.0 143.9 119.9 143.4 April 2024 137.8 120.1 120.8 133.2 158.0 May 2024 144.4 134.5 79.9 130.0 178.4 June 2024 152.1 132.6 75.8 180.2 176.2 July 2024 131.1 124.0 65.3 109.4 167.2 August 2024 140.4 128.5 71.2 137.4 172.0 September 2024 132.0 116.2 82.9 143.7 152.6 October 2024 140.7 123.5 118.0 130.3 165.4 November 2024 155.7 125.9 140.7 129.2 198.0 December 2024 166.8 145.4 161.8 131.5 201.8 January 2025 137.3 111.3 178.0 118.6 153.3 February 2025 129.2 110.5 154.5 115.7 141.1 March 2025 145.2 125.0 143.0 148.1 158.5 April 2025 142.9 126.9 109.0 137.7 167.4 May 2025 153.9 131.4 94.2 160.5 186.8 June 2025 157.9 132.3 78.5 190.4 186.5 Explanation of symbolsDownload table as ... - Index of household consumption of goods. Percentage volume change from the same month in the previous year. Unadjusted. 2005=100Download table as ...Index of household consumption of goods. Percentage volume change from the same month in the previous year. Unadjusted. 2005=100
Total Food, beverages and tobacco Electricity and heating fuels Purchases of vehicles and petrol Other goods July 2023 -2.8 -1.5 -2.1 -5.9 -2.6 August 2023 -3.8 -1.2 4.3 -12.5 -2.5 September 2023 -6.9 -0.9 2.4 -24.0 -3.2 October 2023 -3.8 -0.4 20.8 -21.6 -2.6 November 2023 -6.8 -0.7 29.0 -37.5 -1.4 December 2023 -17.9 -2.8 10.9 -59.5 -3.2 January 2024 4.7 -3.6 21.4 29.4 -1.6 February 2024 4.2 4.2 20.5 -2.2 1.3 March 2024 -11.4 -2.4 -3.9 -36.0 -5.3 April 2024 7.2 0.8 10.2 12.1 9.4 May 2024 0.5 3.7 -10.8 -14.2 7.3 June 2024 -0.4 -3.9 16.9 6.5 -3.4 July 2024 1.9 2.2 7.7 -7.8 4.8 August 2024 2.0 2.0 6.7 1.0 1.9 September 2024 1.6 -3.1 9.8 13.7 -1.5 October 2024 5.9 3.5 -0.3 12.3 6.7 November 2024 2.9 2.6 -7.3 6.1 4.7 December 2024 -0.2 -1.6 -11.9 6.0 2.5 January 2025 7.1 1.6 -8.2 36.9 8.6 February 2025 1.8 -3.1 -3.8 12.9 3.6 March 2025 5.7 -6.0 -0.6 23.5 10.5 April 2025 3.7 5.7 -9.8 3.3 6.0 May 2025 6.6 -2.3 17.9 23.5 4.7 June 2025 3.8 -0.2 3.6 5.6 5.8 Explanation of symbolsDownload table as ... - Index of household consumption of goods. Volume index. Seasonally adjusted. 2005=100Download table as ...Index of household consumption of goods. Volume index. Seasonally adjusted. 2005=100
Total Food, beverages and tobacco Electricity and heating fuels Purchases of vehicles and petrol Other goods July 2023 141.8 124.3 107.1 121.5 153.0 August 2023 139.7 123.8 109.5 114.2 152.4 September 2023 137.0 124.2 105.6 106.6 152.2 October 2023 139.9 124.3 122.5 110.4 152.5 November 2023 141.4 123.6 126.4 112.8 154.3 December 2023 141.6 124.5 125.0 119.0 152.6 January 2024 134.7 123.0 126.3 91.2 150.9 February 2024 138.7 123.9 120.7 107.5 151.4 March 2024 137.3 123.4 119.6 108.2 152.5 April 2024 142.6 126.1 120.4 119.4 154.2 May 2024 141.8 128.2 97.3 111.7 162.5 June 2024 145.6 123.6 119.8 133.4 154.3 July 2024 139.7 123.8 116.4 106.6 155.6 August 2024 141.9 125.3 117.9 116.5 155.1 September 2024 142.8 125.1 117.8 122.7 156.1 October 2024 142.7 124.6 120.2 120.1 157.7 November 2024 143.8 125.9 117.8 120.1 160.3 December 2024 142.2 124.1 111.8 123.7 158.4 January 2025 146.2 124.4 116.0 124.8 163.4 February 2025 147.5 125.0 118.2 128.9 163.1 March 2025 147.4 124.1 115.9 127.8 165.2 April 2025 148.7 125.0 111.1 132.1 166.9 May 2025 149.4 124.7 115.5 134.3 166.5 June 2025 151.3 123.8 125.8 139.1 166.3 Explanation of symbolsDownload table as ... - Index of household consumption of goods. Percentage volume change from the previous month. Seasonally adjusted. 2005=100Download table as ...Index of household consumption of goods. Percentage volume change from the previous month. Seasonally adjusted. 2005=100
Total Food, beverages and tobacco Electricity and heating fuels Purchases of vehicles and petrol Other goods July 2023 0.3 -0.3 3.4 1.8 -1.0 August 2023 -1.5 -0.4 2.2 -6.0 -0.4 September 2023 -1.9 0.3 -3.5 -6.7 -0.1 October 2023 2.1 0.1 16.0 3.6 0.2 November 2023 1.1 -0.6 3.2 2.1 1.2 December 2023 0.1 0.7 -1.1 5.5 -1.1 January 2024 -4.9 -1.2 1.0 -23.3 -1.1 February 2024 3.0 0.7 -4.4 17.8 0.4 March 2024 -1.0 -0.4 -0.9 0.7 0.7 April 2024 3.9 2.2 0.7 10.3 1.1 May 2024 -0.6 1.7 -19.2 -6.4 5.4 June 2024 2.7 -3.6 23.2 19.4 -5.0 July 2024 -4.1 0.2 -2.9 -20.1 0.8 August 2024 1.6 1.1 1.3 9.4 -0.3 September 2024 0.6 -0.1 -0.1 5.3 0.7 October 2024 -0.1 -0.4 2.0 -2.2 1.0 November 2024 0.8 1.1 -1.9 0.1 1.6 December 2024 -1.1 -1.5 -5.1 2.9 -1.2 January 2025 2.8 0.3 3.8 0.9 3.2 February 2025 0.8 0.5 1.8 3.3 -0.2 March 2025 0.0 -0.8 -2.0 -0.8 1.3 April 2025 0.9 0.8 -4.1 3.3 1.0 May 2025 0.5 -0.2 4.0 1.7 -0.3 June 2025 1.3 -0.7 8.9 3.6 -0.1 Explanation of symbolsDownload table as ...

About the statistics
The information under «About the statistics» was last updated 19 November 2024.
Not relevant
COICOP (Classification of Individual Consumption by Purpose) is used in the calculation of the index of household consumption goods.
Name: Index of household consumption of goods
Topic: Wholesale and retail trade and service activities
Division for National Accounts
National level only
Monthly, usually published at the end of each month (27th, 28th) (m+1)
Not relevant
Data at micro level, information on population, and catalogues are stored in Oracle databases
The index of household consumption of goods has been published since 1998. The index measures the development of the household consumption of both durable and non-durable goods. Since the definitions in the quarterly national accounts are used in the index of household consumption of goods, it can be interpreted as an indicator of household purchases of goods.
One of the reasons for establishing the index of household consumption goods was changes in the index of wholesale and retail sales. As of 1996, the index of wholesale and retail sales was published according to a new classification. After the transition to this new activity classification, the index no longer included sales at petrol stations and sales of motor vehicles. There was user demand for a commodity consumption indicator, which included sales of petrol and motor vehicles, in addition to the index of wholesale and retail sales. Household consumption of electricity and heating oil was also included in the index computations.
The index of household consumption of goods is compiled by the Division for National Accounts. It is a volume index and is released at the end of each month both as seasonally adjusted and unadjusted volume figures.
The index is mainly used by the public sector (ministries, the Central Bank of Norway) and in the financial sector. The index is also used in analysis and research in and outside Statistics Norway.
No external users have access to the statistics and analyses before they are published. Figures are simultaneously accessible for all users on ssb.no at 08.00 am. Prior to this, a minimum of three months' advance notice is given in the Statistics Release Calendar. This is one of Statistics Norway’s key principles for ensuring that all users are treated equally.
The index of household consumption of goods, which describes the development in household consumption of goods, is published at the same time as the index of wholesale and retail sales. As opposed to the index of wholesale and retail sales, the index of household consumption of goods has a wider choice of goods. The calculation of the index is based on information from the index of wholesale and retail sales as well as purchases of motor vehicles (initial registration), sales data from petrol stations (petrol and other goods) and consumption of electricity and heating fuels. This may result in deviations in the development of the two indices.
Not relevant
Not relevant
The index of household consumption of goods measures the development in the consumption of all goods (durable and non-durable) offered to households in Norway. The index does not cover household consumption of goods abroad, such as cross-border shopping.
The most important data source for the index is the index of wholesale and retail sales broken down by detailed industries. Information on the purchases of motor vehicles is based on data from the Norwegian Road Federation regarding the initial registration of cars. Data from the petroleum statistics are used for information on petrol and heating fuels. Household consumption of electricity uses Statistics Norway monthly electricity statistics. Data from the Brewery and Beverage Association is used for houshold purchases of alcoholic and non-alcoholic beverages .
Data from the annual national accounts are used as weights in the calculation of the index of household consumption of goods.
The index of household consumption of goods is based on several sources of official statistics and does not have a separate data collection.
Since Statistics Norway gives high priority to timeliness in the release of statistics, the index of household consumption of goods may have to rely on preliminary estimates in some cases. Such estimates will be replaced in subsequent releases.
The same methods and definitions that are used in the quarterly national accounts (QNA) are used in the calculation of the index of household consumption of goods.
The general formula to calculate the consumption of a consumption group in current prices is as follows:
where VC is the consumption group i in month m in current prices. B denotes the base year.
I is the index of wholesale and retail sales weighted together for consumption (COICOP) group i in month m.
The first formula defines the consumption in current prices and has been used for all consumption groups where the source has been the index of wholesale and retail sales. The index for group i will normally be weighting by the detailed activity group indices that are taken from the index of wholesale and retail sales. The weighting is based on the data for the earnings survey whose starting point is how much each consumption group is purchased in different kind of activity groups (types of shops). The consumption in constant prices is calculated by deflating the COICOP group with the consumers’ price indices for the relevant sub-groups.
C is the consumption of COICOP group i in month m in constant prices.
KPI is the CPI for consumption group i in month m.
Volume indicators included in the calculations are used in the same way as the index of wholesale and retail sales. The formula is defined as follows:
where C is the consumption of COICOP group i in month m in constant prices.
X is the volume indicator (e.g. the number of vehicles) for the consumption group i in month m.
The total consumption of goods in constant prices is defined as the sum of all constant price figures for the different COICOP groups.
The result from the last formula is then used to calculate the index series.
The index of household consumption of goods is seasonally adjusted using the same methods as for the quarterly national accounts. It is adjusted both for calendar and normal seasonal effects including corrections for shopping days and the Easter effect.
See "About seasonal adjustment" below for more information.
Not relevant
The index has been published since January 1998.
Not relevant
Monthly data of household consumption of goods are changed if the sources are updated with new information. Once a year, before publishing the index in September, the base year for the calculations is changed. This may lead to revisions in earlier published series.
Even when monthly data for household consumption of goods are not revised, the seasonally adjusted figures may change as a consequence of updating the series with new monthly figures.
Monthly and quarterly time series are often characterised by considerable seasonal variations, which might complicate their interpretation. Such time series are therefore subjected to a process of seasonal adjustir="ltr" align="lement in order to remove the effects of these seasonal fluctuations. Once data have been adjusted for seasonal effects by X-13-ARIMA or some other seasonal adjustment tool, a clearer picture of the time series emerges.
For more information on seasonal adjustment: metadata on methods: seasonal adjustment (pdf).
The index of household consumption of goods is an indicator which in addition to wholesale and retail sales, takes into consideration purchases of motor vehicles. The households’ consumption of electricity and heating fuels is also included in the index. The purchases/consumption are affected by for instance the number of days in a month where one can register a car and shop, the temperatures and holidays – so-called seasonal and calendar effects. To ease the comparability with previous periods, the figures are seasonally adjusted.
The following table shows the aggregated series as being published and the underlying components (i.e. individual series) that are used to estimate these. The table also shows the components’ weights. These are based on the results for 2014 from the Quarterly National Accounts (QNA).
| Main aggregates | Codes | Weights in 2014 |
| Food, beverages and tobacco | A1, A2, B1, B2 | 32.8 |
| Electricity and heating fuels | D4, D5 | 6.6 |
| Purchases of vehicles and petrol | G1, G2, G3 | 19.1 |
| Other goods | Remaining codes | 41.4 |
| Household consumption of all goods | All | 100.0 |
| Components | ||
| Food | A1 | 21.6 |
| Non-alcoholic beverages | A2 | 3.0 |
| Alcoholic beverages | B1 | 4.6 |
| Tobacco | B2 | 3.6 |
| Clothing and footwear | C1 | 10.3 |
| Materials for the maintenance and repair of dwellings | D2 | 0.1 |
| Electricity | D4 | 5.6 |
| Fuels and heat energy | D5 | 1.0 |
| Furnishings and household equipment | E1 | 6.5 |
| Miscellaneous household goods | E2 | 4.5 |
| Cleaning products and other articles | E4 | 1.2 |
| Medical products, appliances and equipment | F1 | 1.7 |
| Glasses and orthopedics products | F2 | 1.0 |
| Purchase of vehicles | G1 | 12.2 |
| Spare parts and accessories for personal transport equipment | G2 | 1.0 |
| Fuels and lubricants for personal transport equipment | G3 | 6.0 |
| Telephone and telefax equipment | H2 | 0.8 |
| Audio-visual, photographic and information processing equipment | I1 | 3.1 |
| Recreational equipment | I2 | 2.9 |
| Major durables for recreation and culture | I4 | 1.3 |
| Books and other recreational items | I5 | 4.2 |
| Personal goods, durable | L2 | 0.7 |
| Cosmetics and toaltettartikler | L3 | 2.7 |
| Personal effects n.e.c. | L4 | 0.4 |
| Household consumption of all goods | All | 100.0 |
The calculation of both unadjusted and seasonally adjusted figures for the main aggregates is based on the components. Almost all of these components have a clear seasonal pattern. In section 1.3 the characteristics of some of the series are commented on. Turnover from wholesale and retail sales, which represent approximately 80 per cent of the main index, is the main source when estimating the different series. The following factors affect the monthly turnover/consumption regardless of the underlying evolution:
- Number of days in a month. Given identical conditions, the turnover in February is lower than in January, which is valid for all series.
- Number of different days of the week within the month. The number of Saturdays (high turnover) and Sundays (low turnover) is of particular interest.
- Number of holidays within the month with particular focus on whether Ester falls in March or April.
- Christmas shopping which systematically causes high turnover in December and low turnover in January.
For electricity it is mainly the temperatures which affect the monthly consumption. For vehicles and petrol, the high season for purchasing these goods are the summer months. If one wishes to compare two different periods having different seasonal patterns, it is important to identify the size of the seasonal effects. This is the reason for seasonally adjusting the index of household consumption of goods.
Seasonally adjusted series
We have chosen to first adjust all individual components and thereafter aggregate them to calculate the main aggregates. This means that the connection between the aggregates is also valid for seasonally adjusted figures. By adjusting indirectly, we obtain at least as good results as if we had adjusted the main aggregates directly.
To arrive at this conclusion, one has to use the table in chapter 5. That table shows the quality of the seasonally adjusted figures as well as other analyses in the form of diagrams and figures from X-13-ARIMA.
Even though the seasonal pattern for the individual series can change over time, we can still draw some conclusions regarding the main aggregates. The graphs below show the expected correction factors for 2015 using the same assumptions as documented in the following chapters.
Expected correction factors 2015
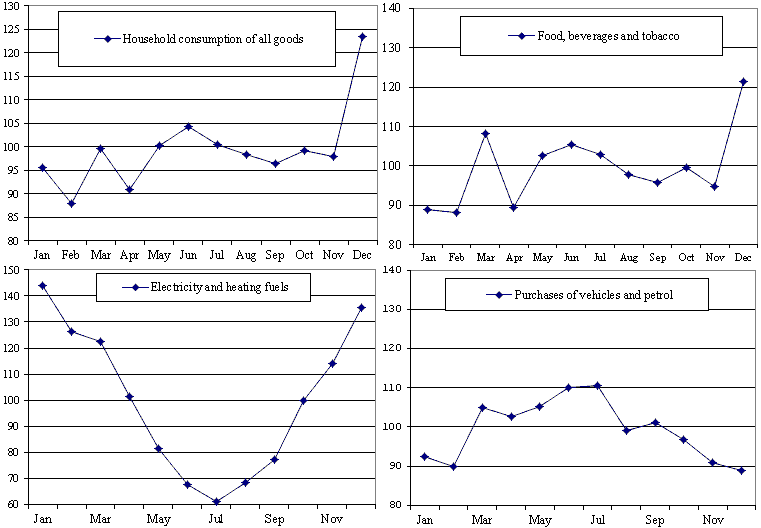
The series for the household consumption of all goods (i.e. the main index) shows that the highest turnover is in December and the lowest in January and February (Christmas effects). For the period May – November seasons are less relevant. How March and April are treated, depends on when Easter falls. If Easter falls in April, there will be only minor corrections as it will be considered as part of the normal season. The adjustments will be larger if Easter falls in March.
As regards seasonal adjustment of electricity consumption, the graph shows that this series has a very clear and strongly defined seasonal pattern, shaped as a U, within the year. The main reason is the temperatures. In April and October, there are hardly any adjustments as it is considered as average annual consumption. January and December are the two months that are adjusted most (approximately 30 per cent). The consumption is lower in February than in March, which is due to there being fewer days in February.
Lastly we see that May, June and especially July are the months with the highest turnover for vehicles and petrol. The turnover for this series is clearly lower in January and February than all other months in the year.
Pre-treatment routines/schemes
Pre-treatment is an adjustment for variations caused by calendar effects and outliers.
- Running a detailed pre-treatment. This means using models which are specially adapted for the pre-treatment of the raw data for a given series.
Calendar adjustment
Calendar adjustment involves adjusting for the effects of working days/trading days and for moving holidays. Working days/trading days are adjustment for both the number of working days/trading days and for that the composition of days can vary from one month to another.
- To perform calendar adjustments on all series showing significant and plausible calendar effects within a statistically robust approach, such as regression or RegARIMA (a regression model with an ARIMA structure for the residuals).
Methods for trading/working day adjustment
- RegARIMA correction – in this case, the effect of trading days is estimated in a RegARIMA framework. The effect of trading days can be estimated by using a correction for the length of the month or leap year, regressing the series on the number of working days, etc. In this case, the residuals will have an ARIMA structure.
Correction for moving holidays
- Correction based on an estimation of the duration of the moving holidays effects, specifically adjusted to Norwegian circumstances.
Comments : Easter and Whitsun are corrected for if being significant.
National and EU/Euro area calendars
- Use of the Norwegian calendar or the EU/Euro area calendar as appropriate; the EU/Euro area calendar is based on the mean number of working days in the different member states.
Comments : In the index of household consumption of goods the Norwegian calendar is in use.
Treatment of outliers
Outliers, or extreme values, are abnormal values of the series.
- Outliers are detected automatically by the seasonal adjustment tool. The outliers are removed before seasonal adjustment is carried out, and then reintroduced into the seasonally adjusted data.
Model selection
Pre-treatment requires choosing an ARIMA model, as well as deciding whether the data should be log-transformed or not.
- Automatic model selection by established routines in the seasonal adjustment tool.
Decomposition scheme
The decomposition scheme specifies how the various components – basically trend-cycle, seasonal and irregular – combine to form the original series. The most frequently used decomposition schemes are the multiplicative, additive or log additive.
- Automatic decomposition scheme selection.
Comments : In the index of household consumption of goods log additive decomposition is in use.
Choice of seasonal adjustment approach
- X-13-ARIMA
Consistency between raw and seasonally adjusted data
In some series, consistency between raw and seasonally adjusted series is imposed.
- In the index of household consumption of goods, the equality over the year of seasonally adjusted data to the unadjusted data (e.g. sum or average) is imposed.
Consistency between aggregate/definition of seasonally adjusted data
In some series, consistency between seasonally adjusted totals and the original series is imposed. For some series there is also a special relationship between the different series, e.g. GDP which equals production minus intermediate consumption.
- Do not apply any constraint.
Comments : In the index of household consumption of goods this is not relevant.
Direct versus indirect approach
Direct seasonal adjustment is performed if all time series, including aggregates, are seasonally adjusted on an individual basis. Indirect seasonal adjustment is performed if the seasonally adjusted estimate for a time series is derived by combining the estimates for two or more directly adjusted series.
- We use indirect approach where the seasonal adjustment of components occurs using the same approach and software, and then totals are derived by aggregation of the seasonally adjusted components.
Horizon for estimating the model and the correction factors
When performing seasonal adjustment of a time series, it is possible to choose the period to be used in estimating the model and the correction factors. Correction factors are the factors used in the pre-treatment and seasonal adjustment of the series.
- The whole time series are used to estimate the model and the correction factors.
- Only part of the time series is used to estimate the correction factors and the model.
Comments : The series start in 2000 to estimate the model and the correction factors.
Seasonally adjusted data may change due to a revision of the unadjusted (raw) data or the addition of new data. There are several ways to deal with the problem of revisions when publishing the seasonally adjusted statistics.
- Both raw and seasonally adjusted data are revised between two consecutive official releases of the release calendar.
Comments : Due to Statistics Norway giving high priority to timeliness, the index of household consumption of goods may have to rely on preliminary estimates in some cases. This means that such estimates will be replaced in subsequent releases. As regards the seasonally adjusted figures, the figures for previous periods may be revised when a new observation is added to the series of raw data. Revised figures are published in the official monthly release of the index of household consumption.
In the following table , indications are given regarding expected revisions for seasonally adjusted rates of change for the main aggregates when adjusted directly.
Concurrent versus current adjustment
- The model, filters, outliers and regression parameters are re-identified and re-estimated continuously as new or revised data become available.
Horizon for published revisions
- The last 4 years in time series are revised in the event of a re-estimation of the seasonal factors. History before T-4 remainsunchanged provided no changes in the unadjusted data.
Evaluation of seasonally adjustment data
- Continuous evaluation using standard measures proposed by different seasonal adjustment tools.
Quality measures for seasonal adjustment
- For most of the series, a selected set of diagnostics and graphical facilities for bulk treatment of data is used.
The following table is a table of quality measurement for this statistics. For more information on the quality indicators in the table see: metadata on methods: seasonal adjustment.
Comments to the table of qualitative indicators
All series are adjusted with the multiplicative method. The main aggregates’ results are calculated via X-13-ARIMA even though these series in practice are adjusted indirectly.
X-13-ARIMA chooses automatically the most appropriate model for the individual series, except for major durables for recreation and materials for the maintenance and repair of dwellings where the model is chosen manually.
ANOVA shows that the rates of change for the original series are primarily due to seasonal and trading day effects and not due to the trend. The contribution from the irregular component is also low. We see for the total index, that more than 99 per cent of the rate of change value is due to seasonal and trading day effects.
ASA and ACH are calculated for 2012-2014. The results for the main aggregates show that revisions of the rates of changes from the previous month ranged from 0,4 percentage points for food, beverages and tobacco to 1,3 percentage points fo spare parts and accessories for personal transport equipment . For the total household consumption of goods, the expected revision of the seasonally adjusted rates of change was approximately 0.3 percentage points.
M and Q values for the main aggregates indicate that the series are well adjusted. The levels and rates of change for the most relevant figures are rarely subject to revision. The seasonal pattern is clearly identified and removed. Both the seasonal pattern and the irregular component are stable.
Seasonal adjustment of short time series
- All series are sufficiently long to perform an optimal seasonal adjustment.
Treatment of problematic series
-
None of the published series are viewed as problematic.
Data availability
- Raw and seasonally adjusted data are available.
- All metadata information associated with an individual time series is available.
Press releases
- In addition to raw data, at least one of the following series is released: pre-treated, seasonally adjusted, seasonally plus working day adjusted and/or trend-cycle series.
- Only levels or different forms of growth rates are presented.
- For each series, some quality measures of the seasonal adjustment are presented.
Comments : In addition to the raw data, seasonally adjusted series are published both as an index and as growth rates (change in per cent compared with the previous month). The seasonally adjusted index and the trend are published graphically in the Monthly Bulletin of Statistics.
Statistics Norway’s metadata on methods: seasonal adjustment (pdf)
EUROSTAT: Seasonal Adjustment. Methods and Practices
US census: X-13-ARIMA-manual.
Dinh Quang Pham: Nye US Census-baserte metoder for ukedagseffekter for norske data, Notater 2008/58, Statistisk sentralbyrå (pdf)