
Monthly updates of the National Accounts are postponed until further notice. In the meantime, monthly data series will be published every three months together with quarterly national accounts.
Statistikk innhold
Statistics on
National accounts
The national accounts provide an overview of the state and development in the Norwegian economy. Key figures are gross domestic product (GDP), consumption, gross investment, exports and imports, employment and wages, profitability in industries and productivity. 1st to 3rd quarter is published with monthly national accounts in May, August and November. 4th quarter will be published February the following year, figures for t-2 in August.
Selected figures from these statistics
- Final expenditure and gross domestic product. Seasonally adjusted. Percentage change in volumeDownload table as ...Final expenditure and gross domestic product. Seasonally adjusted. Percentage change in volume1
2024 2025 2nd quarter 2026 April 2026 May 2026 June 2026 Gross domestic product 1.4 1.1 0.7 0.3 -0.1 2.5 Gross domestic product Mainland Norway 0.6 1.7 0.3 0.1 0.5 0.0 Petroleum activities and ocean transport 3.9 -1.0 1.7 0.8 -2.2 10.6 Final domestic use of goods and services 0.3 0.7 0.9 0.3 3.0 -3.5 Final consumption expenditure of households and NPISH 1.3 2.6 -0.2 -2.1 0.7 0.0 Final consumption expenditure of general government 1.7 2.4 0.8 0.1 0.4 0.2 Gross fixed capital formation (GFCF) -1.4 0.8 4.4 1.4 1.2 0.3 Total exports 5.8 2.7 -0.1 -0.9 -4.2 8.6 Total imports 5.0 2.6 0.0 -1.4 1.7 -4.1 Employed persons 0.7 0.7 0.2 Total hours worked 0.5 0.4 0.2 1Figures from 2024 onwards are preliminary. Explanation of symbolsDownload table as ... - Final expenditure and gross domestic product. Monthly. Seasonally adjusted figures. Percentage change in volume from the previous periodDownload table as ...Final expenditure and gross domestic product. Monthly. Seasonally adjusted figures. Percentage change in volume from the previous period1
November 2025 December 2025 January 2026 February 2026 March 2026 April 2026 May 2026 June 2026 Final consumption expenditure of households and NPISHs 3.3 1.4 -4.5 1.2 1.6 -2.1 0.7 0.0 ¬ Household final consumption expenditure 3.3 1.4 -4.6 1.2 1.9 -2.4 0.8 0.4 ¬¬ Goods 7.4 2.2 -10.4 2.7 5.4 -5.7 2.2 0.4 ¬¬ Services 0.2 0.5 0.0 0.0 -0.1 0.0 0.1 -0.1 ¬¬ Direct purchases abroad by resident households 0.2 4.0 -0.5 0.8 -3.3 -0.1 0.1 -0.4 ¬¬ Direct purchases by non-residents -2.4 3.1 0.5 -1.1 -0.3 -1.0 3.2 -5.4 ¬ Final consumption expenditure of NPISHs 2.8 1.7 -2.3 1.2 -3.1 2.4 -1.3 -5.4 Final consumption expenditure of general governmen 0.1 0.4 0.0 -0.2 0.6 0.1 0.4 0.2 ¬ Final consumption expenditure of central government 0.0 0.5 0.0 0.0 0.4 0.1 0.3 0.4 ¬¬¬ Central government, civilian -0.1 0.5 -0.1 -0.1 0.5 0.1 0.2 0.5 ¬¬¬ Central government, defence 0.2 0.3 0.2 0.4 0.3 0.2 0.8 0.2 ¬ Final consumption expenditure of local government 0.3 0.3 0.0 -0.4 0.7 0.1 0.6 -0.1 Gross fixed capital formation (GFCF) 0.5 3.8 -10.7 0.3 3.0 1.4 1.2 0.3 ¬ Extraction and transport via pipelines (GFCF) -2.8 1.5 -9.7 -5.6 5.3 7.0 2.8 -2.0 ¬ Ocean transport (GFCF) .. 1 166.0 -92.4 -1.3 0.1 6.1 358.5 -78.3 ¬ Mainland Norway (GFCF) 1.2 3.6 -10.2 1.9 2.4 -0.1 0.5 1.3 ¬¬ Mainland Norway excluding general government (GFCF) 2.3 5.0 -11.1 2.9 2.6 -1.4 0.7 1.8 ¬¬¬ Industries (GFCF) 2.8 5.6 -13.2 3.2 4.1 -3.3 1.9 2.6 ¬¬¬¬ Services activities incidential to extraction (GFCF) -8.6 -1.4 -20.9 -4.3 5.2 -18.1 1.6 0.0 ¬¬¬¬ Other services (GFCF) 4.3 8.3 -18.1 6.3 5.1 -4.3 0.0 0.8 ¬¬¬¬ Manufacturing and mining (GFCF) -1.0 1.3 -8.6 -1.3 2.7 1.5 0.5 0.9 ¬¬¬¬ Production of other goods (GFCF) 2.8 0.7 4.3 -2.3 1.7 -1.4 10.0 9.7 ¬¬¬ Dwelling service (households) (GFCF) 1.3 3.2 -5.7 2.2 -1.0 3.3 -2.3 0.1 ¬¬¬ General government (GFCF) -1.6 0.2 -8.0 -0.7 1.9 3.4 0.2 -0.2 Acquisitions less disposals of valuables -0.3 4.8 2.8 0.8 -1.5 -0.2 -1.3 -0.6 Changes in stocks and statistical discrepancies .. .. .. .. .. .. .. .. Gross capital formation 11.9 1.9 -3.7 14.3 -11.8 5.4 10.1 -12.8 Final domestic use of goods and services 4.4 1.3 -3.1 4.0 -2.3 0.3 3.0 -3.5 Final demand from Mainland Norway (excl. changes in stocks) 2.0 1.6 -4.6 0.9 1.5 -1.1 0.6 0.3 Final demand from general government -0.2 0.4 -1.5 -0.3 0.8 0.7 0.4 0.1 Total exports -4.0 -1.1 2.1 -4.5 3.6 -0.9 -4.2 8.6 ¬ Traditional goods (export) -8.0 -6.5 8.9 -6.2 3.3 0.3 1.5 2.3 ¬ Crude oil and natural gas (export) -2.9 0.3 1.9 -4.1 4.7 -2.3 -9.8 14.3 ¬ Ships, oil platforms and aircraft (export) -59.5 148.0 88.5 -78.3 74.4 -49.5 84.6 368.9 ¬ Services (export) -0.5 0.9 -6.0 -0.5 0.7 1.7 0.8 0.1 Total use of goods and services 1.0 0.4 -1.2 0.7 -0.1 -0.1 0.3 0.9 Total imports 3.5 1.2 -6.7 5.3 -0.1 -1.4 1.7 -4.1 ¬ Traditional goods (import) 6.1 0.4 -6.6 7.3 -1.3 -0.5 2.2 -6.4 ¬ Crude oil and natural gas (import) -20.3 -7.5 -29.1 11.0 15.0 36.5 -16.8 26.5 ¬ Ships, oil platforms and aircraft (import) 56.0 25.0 -55.6 35.8 49.4 0.4 34.9 -32.5 ¬ Services (import) -0.1 2.4 -4.8 1.7 0.9 -4.1 0.9 -0.1 Gross domestic product, market values2 0.2 0.1 0.7 -0.7 -0.2 0.3 -0.1 2.5 Gross domestic product Mainland Norway, market values2 0.3 -0.1 0.6 -0.8 0.2 0.1 0.5 0.0 Petroleum activities and ocean transport3 0.0 0.8 1.2 -0.3 -1.3 0.8 -2.2 10.6 Gross domestic product Mainland Norway, basic values 0.2 -0.2 0.8 -0.9 0.2 0.1 0.6 0.1 ¬ Mainland Norway excluding general government (GDP) 0.3 -0.3 1.0 -1.1 0.1 0.2 0.6 0.1 ¬¬ Manufacturing and mining (GDP) 2.5 -0.5 0.5 -0.5 0.9 0.3 1.4 -1.6 ¬¬ Production of other goods (GDP) -1.2 1.2 3.1 -4.9 -2.0 0.3 2.9 2.6 ¬¬ Service activities (GDP) 0.3 -0.5 0.6 -0.4 0.5 0.1 -0.1 -0.2 ¬ General government (GDP) 0.0 0.0 0.1 -0.3 0.6 -0.2 0.6 0.0 Taxes and subsidies products 1.0 0.4 -1.1 0.1 0.0 0.3 0.1 -0.3 1Figures from 2024 onwards are preliminary 2Gross domestic product is measured at market prices, while value added by industry is measured at basic prices 3Includes oil and gas extraction, transport via pipelines and ocean transport Explanation of symbolsDownload table as ... - Final expenditure and gross domestic product. Rolling three-month sum. Seasonally adjusted. Percentage change in volumeDownload table as ...Final expenditure and gross domestic product. Rolling three-month sum. Seasonally adjusted. Percentage change in volume1 2
September 2025 - November 2025 October 2025 - December 2025 November 2025 - January 2026 December 2025 - February 2026 January 2026 - March 2026 February 2026 - April 2026 March 2026 - May 2026 April 2026 - June 2026 Final consumption expenditure of households and NPISHs -0.5 0.8 1.8 0.7 -1.2 -1.1 -0.4 -0.2 ¬ Household final consumption expenditure 0.2 1.4 1.8 0.5 -1.3 -1.1 -0.3 -0.1 ¬¬ Goods 0.9 3.2 3.4 -0.1 -3.7 -2.5 0.0 0.0 ¬¬ Services 0.0 0.3 0.6 0.7 0.3 0.1 -0.1 0.0 ¬¬ Direct purchases abroad by resident households 0.7 0.2 1.6 3.2 1.6 -0.5 -2.9 -2.1 ¬¬ Direct purchases by non-residents 4.7 3.8 2.6 1.8 0.9 -0.3 -0.4 -1.2 ¬ Final consumption expenditure of NPISHs -10.6 -7.6 2.0 2.7 -0.5 -1.0 -1.9 -2.0 Final consumption expenditure of general governmen 0.5 0.6 0.6 0.5 0.3 0.3 0.6 0.8 ¬ Final consumption expenditure of central government 0.4 0.3 0.3 0.4 0.4 0.4 0.6 0.7 ¬¬¬ Central government, civilian 0.3 0.2 0.2 0.3 0.3 0.4 0.5 0.6 ¬¬¬ Central government, defence 1.2 1.2 1.0 0.9 0.9 0.9 1.1 1.1 ¬ Final consumption expenditure of local government 0.7 1.0 0.9 0.5 0.3 0.2 0.7 0.8 Gross fixed capital formation (GFCF) 3.3 5.0 1.2 -2.8 -7.2 -3.6 0.5 4.4 ¬ Extraction and transport via pipelines (GFCF) 1.2 0.8 -3.9 -8.1 -11.5 -6.2 3.2 9.9 ¬ Ocean transport (GFCF) -25.4 6.3 90.2 88.9 -75.2 -80.2 -54.9 131.9 ¬ Mainland Norway (GFCF) 3.9 6.3 2.5 -1.4 -5.8 -2.6 0.0 2.9 ¬¬ Mainland Norway excluding general government (GFCF) 3.4 6.1 3.3 -0.3 -4.9 -2.2 -0.3 2.3 ¬¬¬ Industries (GFCF) 4.8 7.8 4.0 -0.8 -6.0 -3.0 -0.3 2.5 ¬¬¬¬ Services activities incidential to extraction (GFCF) 50.7 54.2 13.4 -9.7 -25.0 -21.4 -17.2 -15.7 ¬¬¬¬ Other services (GFCF) 4.1 7.7 3.9 -0.9 -7.3 -3.0 -0.9 1.1 ¬¬¬¬ Manufacturing and mining (GFCF) 4.4 3.8 -0.6 -4.5 -8.1 -4.5 -0.1 3.6 ¬¬¬¬ Production of other goods (GFCF) 2.7 6.2 7.4 4.6 4.8 1.4 3.9 9.0 ¬¬¬ Dwelling service (households) (GFCF) 0.1 2.0 1.3 0.8 -2.2 -0.3 -0.1 1.8 ¬¬¬ General government (GFCF) 5.2 6.6 0.7 -4.1 -8.2 -3.8 0.9 4.5 Acquisitions less disposals of valuables -2.2 0.0 4.0 6.9 6.0 3.1 -0.7 -2.1 Changes in stocks and statistical discrepancies 679.7 -2 649.1 60.7 -72.8 -100.3 -105.4 -68.4 -3 634.5 Gross capital formation -2.6 -8.7 -1.9 2.1 6.2 5.1 1.8 3.2 Final domestic use of goods and services -0.7 -1.7 0.6 1.0 1.0 0.8 0.5 0.9 Final demand from Mainland Norway (excl. changes in stocks) 0.7 1.9 1.6 0.2 -1.8 -1.0 0.0 0.7 Final demand from general government 1.4 1.7 0.6 -0.4 -1.3 -0.4 0.7 1.4 Total exports 4.1 3.5 0.0 -1.6 -1.8 -1.5 -0.9 -0.1 ¬ Traditional goods (export) -0.7 0.3 -4.2 -3.7 -2.1 -0.7 2.5 2.1 ¬ Crude oil and natural gas (export) 7.2 5.8 2.2 -0.1 -0.1 -0.5 -2.4 -2.9 ¬ Ships, oil platforms and aircraft (export) -12.9 -0.7 44.4 71.2 25.3 -55.0 -47.3 37.5 ¬ Services (export) 3.4 2.7 -0.2 -3.2 -5.7 -3.3 -0.3 2.6 Total use of goods and services 1.0 0.3 0.4 0.0 -0.1 -0.1 0.0 0.5 Total imports 1.9 2.8 2.2 0.4 -1.5 0.4 0.7 0.0 ¬ Traditional goods (import) 2.5 4.8 4.6 2.3 -0.4 1.5 1.4 0.2 ¬ Crude oil and natural gas (import) 11.7 8.1 -12.9 -30.3 -30.1 5.0 27.0 48.4 ¬ Ships, oil platforms and aircraft (import) -27.3 -25.1 -7.5 -7.3 -15.8 7.4 47.9 51.4 ¬ Services (import) 1.4 0.3 -0.8 -1.1 -2.0 -1.7 -2.2 -2.5 Gross domestic product, market values3 0.7 -0.6 -0.2 -0.2 0.4 -0.2 -0.3 0.7 Gross domestic product Mainland Norway, market values -0.1 0.2 0.5 0.3 0.1 -0.3 0.1 0.3 Petroleum activities and ocean transport4 3.4 -2.8 -2.5 -1.5 1.1 0.1 -1.4 1.7 Gross domestic product Mainland Norway, basic values -0.2 0.0 0.4 0.3 0.2 -0.3 0.1 0.3 ¬ Mainland Norway excluding general government (GDP) -0.3 -0.1 0.5 0.3 0.2 -0.4 0.0 0.3 ¬¬ Manufacturing and mining (GDP) -1.4 -0.7 0.7 0.9 1.0 0.4 1.4 1.2 ¬¬ Production of other goods (GDP) -1.2 -1.8 0.3 0.3 -0.5 -3.8 -3.2 0.0 ¬¬ Service activities (GDP) 0.1 0.4 0.5 0.2 0.2 0.2 0.5 0.2 ¬ General government (GDP) 0.0 0.2 0.3 0.1 0.2 0.2 0.5 0.5 Taxes and subsidies products 1.0 1.6 1.3 0.5 -0.4 -0.4 0.0 0.3 1Figures from 2024 onwards are prelimanry 2Rolling three-month growth is calculated by comparing a three-month period with the previous three-month period, for example growth in May to July compared with February to April. Furthermore, March, June, September and December represent the quarters in a year. For example, March will represent the first quarter. 3Gross domestic product is measured at market prices, while value added by industry is measured at basic prices. 4Includes oil and gas extraction, transport via pipelines and ocean transport. Explanation of symbolsDownload table as ... - Final expenditure and gross domestic product. Quarter and year. At current prices. NOK millionDownload table as ...Final expenditure and gross domestic product. Quarter and year. At current prices. NOK million1
2024 2025 2nd quarter 2025 3rd quarter 2025 4th quarter 2025 1st quarter 2026 2nd quarter 2026 Final consumption expenditure of households and NPISHs 2 212 165 2 340 592 587 138 571 281 626 768 582 021 606 198 ¬ Household final consumption expenditure 2 084 291 2 205 940 552 879 538 043 592 001 548 843 572 188 ¬¬ Goods 831 627 900 697 225 216 218 192 257 976 212 868 234 345 ¬¬ Services 1 164 079 1 223 653 304 901 303 628 310 076 319 228 318 504 ¬¬ Direct purchases abroad by resident households 170 141 180 669 46 971 56 934 40 771 36 966 45 446 ¬¬ Direct purchases by non-residents -81 556 -99 079 -24 209 -40 711 -16 822 -20 218 -26 107 ¬ Final consumption expenditure of NPISHs 127 875 134 652 34 259 33 238 34 767 33 178 34 011 Final consumption expenditure of general governmen 1 187 108 1 254 975 321 752 312 546 316 800 318 742 336 574 ¬ Final consumption expenditure of central government 608 481 644 767 165 506 158 978 165 478 163 537 172 822 ¬¬¬ Central government, civilian 529 055 553 909 141 949 136 788 141 307 140 690 148 163 ¬¬¬ Central government, defence 79 426 90 858 23 557 22 190 24 172 22 847 24 659 ¬ Final consumption expenditure of local government 578 627 610 208 156 246 153 568 151 322 155 204 163 753 Gross fixed capital formation (GFCF) 1 235 211 1 284 386 319 282 310 012 366 001 290 133 325 265 ¬ Extraction and transport via pipelines (GFCF) 259 345 281 385 73 227 71 120 74 018 63 825 71 360 ¬ Ocean transport (GFCF) 9 405 2 819 746 692 840 176 440 ¬ Mainland Norway (GFCF) 966 461 1 000 182 245 309 238 200 291 143 226 132 253 465 ¬¬ Industries (GFCF) 476 461 504 920 126 096 118 869 142 139 118 108 130 205 ¬¬¬ Services activities incidential to extraction (GFCF) 10 556 10 809 1 802 2 670 4 547 2 736 2 141 ¬¬¬ Other services (GFCF) 317 271 331 784 82 671 77 343 90 779 78 718 82 993 ¬¬¬ Manufacturing and mining (GFCF) 73 244 76 707 18 509 18 469 23 511 16 529 18 772 ¬¬¬ Production of other goods (GFCF) 75 391 85 620 23 114 20 387 23 303 20 124 26 300 ¬¬ welling service (households) (GFCF) 207 290 208 731 51 825 51 636 53 581 53 318 54 861 ¬¬ General government (GFCF) 282 709 286 532 67 389 67 696 95 423 54 706 68 399 Acquisitions less disposals of valuables 311 330 84 81 86 85 88 Changes in stocks and statistical discrepancies 38 275 -19 349 -11 833 -197 -58 221 34 532 -35 846 Gross capital formation 1 273 797 1 265 368 307 533 309 896 307 866 324 751 289 508 Final domestic use of goods and services 4 673 070 4 860 935 1 216 423 1 193 723 1 251 434 1 225 514 1 232 280 Final demand from Mainland Norway (excl. changes in stocks) 4 365 734 4 595 749 1 154 199 1 122 027 1 234 711 1 126 895 1 196 238 Final demand from general government 1 469 818 1 541 507 389 141 380 242 412 223 373 448 404 973 Total exports 2 496 349 2 511 847 595 493 612 087 632 073 656 670 700 868 ¬ Traditional goods (export) 671 680 721 874 170 255 179 905 195 845 174 431 181 622 ¬ Crude oil and natural gas (export) 1 169 314 1 099 907 255 900 248 067 264 061 328 362 346 645 ¬ Ships, oil platforms and aircraft (export) 12 115 14 689 3 099 3 018 2 594 3 345 4 684 ¬ Services (export) 643 240 675 376 166 238 181 097 169 573 150 532 167 918 Total use of goods and services 7 169 419 7 372 782 1 811 916 1 805 810 1 883 507 1 882 184 1 933 149 Total imports 1 786 978 1 861 448 464 185 473 011 485 601 443 388 468 710 ¬ Traditional goods (import) 1 036 982 1 082 381 269 222 265 515 289 264 265 644 280 218 ¬ Crude oil and natural gas (import) 20 744 20 554 3 921 5 880 5 193 3 357 5 290 ¬ Ships, oil platforms and aircraft (import) 41 163 23 537 7 062 4 759 4 511 3 360 4 989 ¬ Services (import) 688 089 734 976 183 980 196 857 186 633 171 027 178 213 Gross domestic product, market values2 5 382 441 5 511 334 1 347 731 1 332 799 1 397 906 1 438 796 1 464 438 Gross domestic product Mainland Norway, market values2 4 191 794 4 397 716 1 092 913 1 070 621 1 140 735 1 127 346 1 135 956 Petroleum activities and ocean transport3 1 190 647 1 113 618 254 818 262 178 257 172 311 450 328 483 Gross domestic product Mainland Norway, basic values 3 717 522 3 909 884 970 786 949 487 1 008 474 1 018 820 1 015 979 ¬ Mainland Norway excluding general government (GDP) 2 823 977 2 967 826 726 927 714 644 772 162 781 964 762 499 ¬¬ Manufacturing and mining (GDP) 317 339 341 228 88 855 81 348 86 479 76 027 87 316 ¬¬ Production of other goods (GDP) 446 790 471 746 101 407 114 013 128 363 145 221 114 291 ¬¬ Service activities (GDP) 2 059 848 2 154 852 536 666 519 283 557 319 560 716 560 891 ¬ General government (GDP) 893 544 942 058 243 859 234 843 236 311 236 856 253 480 Taxes and subsidies products 474 272 487 832 122 127 121 134 132 261 108 526 119 977 1Figures from 2024 onwards are prelimanry 2Gross domestic product is measured at market prices, while value added by industry is measured at basic prices 3Includes oil and gas extraction, transport via pipelines and ocean transport. Explanation of symbolsDownload table as ... - Final expenditure and gross domestic product. Quarter and year. At constant 2023-prices. NOK millionDownload table as ...Final expenditure and gross domestic product. Quarter and year. At constant 2023-prices. NOK million1
2024 2025 2nd quarter 2025 3rd quarter 2025 4th quarter 2025 1st quarter 2026 2nd quarter 2026 Final consumption expenditure of households and NPISHs 2 139 469 2 195 955 550 939 536 649 586 111 532 733 556 756 ¬ Household final consumption expenditure 2 015 499 2 069 124 518 896 505 169 553 799 501 309 525 405 ¬¬ Goods 815 727 862 828 216 533 207 529 245 944 200 497 219 470 ¬¬ Services 1 115 390 1 131 228 281 492 282 799 285 797 284 306 285 578 ¬¬ Direct purchases abroad by resident households 163 045 167 748 43 740 52 533 37 645 35 022 44 115 ¬¬ Direct purchases by non-residents -78 664 -92 680 -22 870 -37 691 -15 588 -18 515 -23 759 ¬ Final consumption expenditure of NPISHs 123 970 126 831 32 042 31 480 32 313 31 424 31 350 Final consumption expenditure of general governmen 1 143 588 1 170 614 291 798 293 428 296 961 294 176 298 345 ¬ Final consumption expenditure of central government 586 273 601 215 149 890 149 920 152 637 151 266 152 761 ¬¬¬ Central government, civilian 509 876 517 007 129 002 128 601 131 044 129 444 130 859 ¬¬¬ Central government, defence 76 397 84 208 20 888 21 319 21 593 21 822 21 902 ¬ Final consumption expenditure of local government 557 315 569 399 141 908 143 508 144 324 142 910 145 584 Gross fixed capital formation (GFCF) 1 180 549 1 190 186 294 501 288 055 337 905 267 156 296 244 ¬ Extraction and transport via pipelines (GFCF) 244 283 261 939 66 757 67 370 69 768 58 175 64 627 ¬ Ocean transport (GFCF) 8 913 2 498 670 647 683 165 401 ¬ Mainland Norway (GFCF) 927 354 925 749 227 074 220 038 267 454 208 816 231 216 ¬¬¬ Industries (GFCF) 456 578 468 878 117 431 110 362 130 876 110 188 120 731 ¬¬¬¬ Services activities incidential to extraction (GFCF) 10 059 10 000 1 662 2 488 4 184 2 621 2 045 ¬¬¬¬ Other services (GFCF) 304 140 308 066 76 973 71 774 83 545 72 833 76 146 ¬¬¬¬ Manufacturing and mining (GFCF) 70 178 71 247 17 212 17 182 21 667 15 671 17 785 ¬¬¬¬ Production of other goods (GFCF) 72 201 79 566 21 584 18 919 21 480 19 063 24 754 ¬¬¬ Dwelling service (households) (GFCF) 199 750 192 610 47 640 47 260 49 075 48 335 48 578 ¬¬¬ General government (GFCF) 271 026 264 262 62 003 62 416 87 503 50 293 61 907 Acquisitions less disposals of valuables 287 294 75 71 76 74 76 Changes in stocks and statistical discrepancies 38 878 -22 293 -15 984 2 137 -57 627 30 483 -28 902 Gross capital formation 1 219 713 1 168 187 278 592 290 264 280 354 297 714 267 419 Final domestic use of goods and services 4 502 770 4 534 756 1 121 329 1 120 341 1 163 427 1 124 623 1 122 520 Final demand from Mainland Norway (excl. changes in stocks) 4 210 410 4 292 318 1 069 811 1 050 116 1 150 527 1 035 725 1 086 317 Final demand from general government 1 414 614 1 434 876 353 801 355 844 384 464 344 469 360 253 Total exports 2 604 461 2 673 535 642 490 676 658 716 096 675 178 673 890 ¬ Traditional goods (export) 680 841 722 172 172 634 187 498 193 827 173 157 177 165 ¬ Crude oil and natural gas (export) 1 285 928 1 296 652 311 420 312 723 358 141 357 528 334 237 ¬ Ships, oil platforms and aircraft (export) 11 856 13 254 2 766 2 548 2 530 3 171 4 361 ¬ Services (export) 625 837 641 456 155 669 173 889 161 598 141 322 158 127 Total use of goods and services 7 107 232 7 208 291 1 763 819 1 796 999 1 879 522 1 799 801 1 796 410 Total imports 1 726 823 1 770 968 442 130 454 502 459 533 425 524 448 570 ¬ Traditional goods (import) 1 028 156 1 061 676 266 927 262 092 281 733 265 887 279 120 ¬ Crude oil and natural gas (import) 22 773 25 729 5 086 7 689 6 685 4 445 5 346 ¬ Ships, oil platforms and aircraft (import) 38 382 20 238 6 294 4 439 3 325 2 801 4 240 ¬ Services (import) 637 512 663 325 163 823 180 283 167 791 152 391 159 865 Gross domestic product, market values 5 380 408 5 437 323 1 321 689 1 342 497 1 419 989 1 374 276 1 347 839 Gross domestic product Mainland Norway, market values 4 047 656 4 117 384 1 010 443 1 011 247 1 070 500 1 029 567 1 023 279 Petroleum activities and ocean transport 1 332 752 1 319 939 311 246 331 250 349 489 344 709 324 560 Gross domestic product Mainland Norway, basic values 3 596 297 3 659 828 896 018 899 171 946 262 920 619 907 230 ¬ Mainland Norway excluding general government (GDP) 2 743 711 2 796 262 679 840 683 312 728 823 705 141 688 767 ¬¬ Manufacturing and mining (GDP) 309 444 321 706 80 657 77 980 82 297 81 324 83 175 ¬¬ Production of other goods (GDP) 461 293 464 013 103 473 116 868 121 931 116 516 100 617 ¬¬ Service activities (GDP) 1 972 974 2 010 543 495 710 488 463 524 595 507 301 504 975 ¬ General government (GDP) 852 586 863 566 216 179 215 859 217 439 215 478 218 463 Taxes and subsidies products 451 359 457 556 114 424 112 076 124 238 108 948 116 049 1Figures from 2024 onwards are preliminary Explanation of symbolsDownload table as ... - Final expenditure and gross domestic product. Quarter and year. Percentage change in volume from the same period in the previous yearDownload table as ...Final expenditure and gross domestic product. Quarter and year. Percentage change in volume from the same period in the previous year1
2024 2025 2nd quarter 2025 3rd quarter 2025 4th quarter 2025 1st quarter 2026 2nd quarter 2026 Final consumption expenditure of households and NPISHs 1.3 2.6 1.4 2.0 4.0 2.0 1.1 ¬ Household final consumption expenditure 1.3 2.7 1.3 2.0 4.2 2.0 1.3 ¬¬ Goods 1.1 5.8 4.0 5.8 9.0 4.0 1.4 ¬¬ Services 1.3 1.4 0.6 1.3 0.9 1.1 1.5 ¬¬ Direct purchases abroad by resident households 8.1 2.9 3.0 2.2 0.5 3.5 0.9 ¬¬ Direct purchases by non-residents 13.7 17.8 25.2 19.1 7.4 12.0 3.9 ¬ Final consumption expenditure of NPISHs 1.6 2.3 2.4 2.0 1.8 1.4 -2.2 Final consumption expenditure of general governmen 1.7 2.4 2.3 2.3 2.8 2.0 2.2 ¬ Final consumption expenditure of central government 2.8 2.5 2.6 2.4 2.6 1.7 1.9 ¬¬¬ Central government, civilian 2.1 1.4 1.3 1.2 1.7 0.8 1.4 ¬¬¬ Central government, defence 8.1 10.2 11.7 10.5 8.6 6.9 4.9 ¬ Final consumption expenditure of local government 0.7 2.2 1.9 2.1 3.1 2.3 2.6 Gross fixed capital formation (GFCF) -1.4 0.8 1.1 -2.3 2.4 -1.0 0.6 ¬ Extraction and transport via pipelines (GFCF) 4.8 7.2 8.8 8.1 6.6 0.2 -3.2 ¬ Ocean transport (GFCF) -58.3 -72.0 -17.8 -76.1 -86.9 -66.8 -40.1 ¬ Mainland Norway (GFCF) -1.7 -0.2 -0.9 -4.2 3.1 -1.1 1.8 ¬¬ Industries (GFCF) 0.7 2.7 0.5 -1.0 6.1 0.0 2.8 ¬¬¬ Services activities incidential to extraction (GFCF) 140.8 -0.6 -24.1 -25.0 55.8 57.4 23.1 ¬¬¬ Other services (GFCF) 1.1 1.3 -0.6 -2.5 2.2 -3.9 -1.1 ¬¬¬ Manufacturing and mining (GFCF) -1.0 1.5 -0.4 6.3 6.6 3.2 3.3 ¬¬¬ Production of other goods (GFCF) -6.9 10.2 8.1 3.2 15.4 8.4 14.7 ¬¬ Dwelling service (households) (GFCF) -12.2 -3.6 -6.6 -4.3 1.6 -0.6 2.0 ¬¬ General government (GFCF) 3.3 -2.5 1.2 -9.4 -0.2 -3.9 -0.2 Acquisitions less disposals of valuables 2.8 2.5 2.9 2.0 2.4 2.6 1.9 Changes in stocks and statistical discrepancies -28.5 .. .. -87.7 .. -38.0 .. Gross capital formation -2.6 -4.2 -0.5 -7.0 -12.1 -6.7 -4.0 Final domestic use of goods and services 0.3 0.7 1.2 -0.4 -0.7 -0.4 0.1 Final demand from Mainland Norway (excl. changes in stocks) 0.8 1.9 1.1 0.7 3.5 1.4 1.5 Final demand from general government 2.0 1.4 2.1 0.0 2.1 1.1 1.8 Total exports 5.8 2.7 -3.0 5.5 7.0 5.8 4.9 ¬ Traditional goods (export) 3.4 6.1 4.3 9.1 4.8 2.9 2.6 ¬ Crude oil and natural gas (export) 4.9 0.8 -8.0 4.6 12.1 13.7 7.3 ¬ Ships, oil platforms and aircraft (export) 30.4 11.8 -4.4 20.0 -30.7 -41.4 57.6 ¬ Services (export) 10.2 2.5 0.3 3.1 0.3 -6.0 1.6 Total use of goods and services 2.3 1.4 -0.4 1.7 2.1 1.8 1.8 Total imports 5.0 2.6 0.8 0.5 2.5 2.6 1.5 ¬ Traditional goods (import) 3.3 3.3 -1.0 0.6 6.6 6.0 4.6 ¬ Crude oil and natural gas (import) -13.9 13.0 17.1 -8.2 32.4 -29.1 5.1 ¬ Ships, oil platforms and aircraft (import) 21.0 -47.3 -1.4 -53.6 -80.4 -54.7 -32.6 ¬ Services (import) 7.9 4.0 3.6 3.6 3.6 0.6 -2.4 Gross domestic product, market values2 1.4 1.1 -0.8 2.2 2.0 1.6 2.0 Gross domestic product Mainland Norway, market values2 0.6 1.7 0.7 1.4 1.7 0.4 1.3 Petroleum activities and ocean transport3 3.9 -1.0 -5.3 4.4 2.9 5.1 4.3 Gross domestic product Mainland Norway, basic values 0.8 1.8 0.7 1.6 1.5 0.2 1.3 ¬ Mainland Norway excluding general government (GDP) 0.4 1.9 0.5 1.7 1.5 0.1 1.3 ¬¬ Manufacturing and mining (GDP) 0.9 4.0 3.8 3.4 2.1 0.7 3.1 ¬¬ Production of other goods (GDP) -1.6 0.6 0.2 -0.4 -0.8 -4.3 -2.8 ¬¬ Service activities (GDP) 0.9 1.9 0.0 2.0 2.0 1.1 1.9 ¬ General government (GDP) 1.9 1.3 1.3 1.0 1.2 0.6 1.1 Taxes and subsidies products -0.3 1.4 0.6 0.5 3.4 2.0 1.4 1Figures from 2024 onwards are prelimanry 2Gross domestic product is measured at market prices, while value added by industry is measured at basic prices. 3Includes oil and gas extraction, transport via pipelines and ocean transport. Explanation of symbolsDownload table as ... - Final expenditure and gross domestic product. Quarter and year. Percentage change in prices from the same period in the previous yearDownload table as ...Final expenditure and gross domestic product. Quarter and year. Percentage change in prices from the same period in the previous year1
2024 2025 2nd quarter 2025 3rd quarter 2025 4th quarter 2025 1st quarter 2026 2nd quarter 2026 Final consumption expenditure of households and NPISHs 3.4 3.1 3.0 3.3 2.9 2.7 2.2 ¬ Household final consumption expenditure 3.4 3.1 3.0 3.3 3.0 2.8 2.2 ¬¬ Goods 1.9 2.4 1.7 3.1 2.7 2.7 2.7 ¬¬ Services 4.4 3.6 3.9 3.7 3.4 3.5 3.0 ¬¬ Direct purchases abroad by resident households 4.4 3.2 3.8 2.8 1.9 -0.8 -4.1 ¬¬ Direct purchases by non-residents 3.7 3.1 2.0 3.5 3.4 4.1 3.8 ¬ Final consumption expenditure of NPISHs 3.2 2.9 3.0 2.9 2.1 1.0 1.5 Final consumption expenditure of general governmen 3.8 3.3 3.7 3.6 2.3 2.8 2.3 ¬ Final consumption expenditure of central government 3.8 3.3 3.9 3.6 2.7 3.9 2.5 ¬¬¬ Central government, civilian 3.8 3.3 3.9 3.7 2.3 4.2 2.9 ¬¬¬ Central government, defence 4.0 3.8 3.7 3.2 5.3 2.0 -0.2 ¬ Final consumption expenditure of local government 3.8 3.2 3.5 3.5 1.8 1.7 2.2 Gross fixed capital formation (GFCF) 4.6 3.1 3.3 3.1 2.1 1.3 1.3 ¬ Extraction and transport via pipelines (GFCF) 6.2 1.2 2.5 0.7 -2.2 1.0 0.7 ¬ Ocean transport (GFCF) 5.5 6.9 2.4 7.5 13.6 -2.0 -1.6 ¬ Mainland Norway (GFCF) 4.2 3.7 3.4 3.8 3.2 1.4 1.5 ¬¬ Industries (GFCF) 4.4 3.2 2.6 3.3 2.8 0.3 0.4 ¬¬¬ Services activities incidential to extraction (GFCF) 4.9 3.0 3.3 2.8 1.9 -2.9 -3.5 ¬¬¬ Other services (GFCF) 4.3 3.2 2.6 3.5 2.9 1.1 1.5 ¬¬¬ Manufacturing and mining (GFCF) 4.4 3.2 2.9 3.1 2.7 -1.2 -1.8 ¬¬¬ Production of other goods (GFCF) 4.4 3.1 2.3 3.1 2.8 -1.4 -0.8 ¬¬ Dwelling service (households) (GFCF) 3.8 4.4 4.5 4.6 4.1 3.8 3.8 ¬¬ General government (GFCF) 4.3 3.9 4.3 4.0 3.2 1.6 1.7 Acquisitions less disposals of valuables 8.4 3.6 3.3 3.5 3.7 3.7 3.6 Changes in stocks and statistical discrepancies -1.6 -11.8 -28.9 .. -8.2 9.5 67.5 Gross capital formation 4.4 3.7 5.1 1.9 3.6 2.3 -1.9 Final domestic use of goods and services 3.8 3.3 3.7 3.0 2.9 2.6 1.2 Final demand from Mainland Norway (excl. changes in stocks) 3.7 3.3 3.3 3.4 2.8 2.5 2.1 Final demand from general government 3.9 3.4 3.8 3.6 2.5 2.6 2.2 Total exports -4.2 -2.0 -3.5 -4.7 -12.1 -7.6 12.2 ¬ Traditional goods (export) -1.3 1.3 -2.3 0.5 2.3 -3.7 3.9 ¬ Crude oil and natural gas (export) -9.1 -6.7 -8.7 -12.5 -26.1 -13.0 26.2 ¬ Ships, oil platforms and aircraft (export) 2.2 8.5 2.6 11.3 0.0 -4.5 -4.1 ¬ Services (export) 2.8 2.4 2.7 2.4 1.3 1.0 -0.6 Total use of goods and services 0.9 1.4 1.3 0.1 -2.8 -1.2 4.8 Total imports 3.5 1.6 1.2 1.3 0.3 -1.5 -0.5 ¬ Traditional goods (import) 0.9 1.1 0.0 0.9 -0.1 -3.0 -0.5 ¬ Crude oil and natural gas (import) -8.9 -12.3 -14.4 -17.7 -12.6 -14.9 28.3 ¬ Ships, oil platforms and aircraft (import) 7.2 8.4 3.1 4.3 21.5 2.9 4.9 ¬ Services (import) 7.9 2.7 3.1 2.4 1.6 1.5 -0.7 Gross domestic product, market values2 0.0 1.3 1.3 -0.3 -3.8 -1.1 6.6 Gross domestic product Mainland Norway, market values2 3.6 3.1 3.1 3.2 2.8 2.7 2.6 Petroleum activities and ocean transport3 -10.7 -5.6 -6.4 -12.0 -24.9 -12.7 23.6 Gross domestic product Mainland Norway, basic values 3.4 3.3 3.3 3.2 3.1 3.6 3.4 ¬ Mainland Norway excluding general government (GDP) 2.9 3.1 2.9 2.8 3.2 3.6 3.5 ¬¬ Manufacturing and mining (GDP) 2.6 3.4 6.8 -2.6 3.9 -10.7 -4.7 ¬¬ Production of other goods (GDP) -3.1 5.0 -0.9 8.4 10.6 18.6 15.9 ¬¬ Service activities (GDP) 4.4 2.7 3.0 2.5 1.5 2.4 2.6 ¬ General government (GDP) 4.8 4.1 4.7 4.4 3.0 3.6 2.9 Taxes and subsidies products 5.1 1.5 1.1 2.8 0.0 -5.3 -3.1 1Figures from 2024 onwards are prelimanry 2Gross domestic product is measured at market prices, while value added by industry is measured at basic prices. 3Includes oil and gas extraction, transport via pipelines and ocean transport. Explanation of symbolsDownload table as ... - Final expenditure and gross domestic product. Quarter and year. Seasonally adjusted figures. At current prices. NOK millionDownload table as ...Final expenditure and gross domestic product. Quarter and year. Seasonally adjusted figures. At current prices. NOK million1
2024 2025 2nd quarter 2025 3rd quarter 2025 4th quarter 2025 1st quarter 2026 2nd quarter 2026 Final consumption expenditure of households and NPISHs 2 212 165 2 340 592 580 235 593 081 597 619 596 654 596 643 ¬ Household final consumption expenditure 2 084 291 2 205 940 546 744 556 666 563 904 563 115 563 533 ¬¬ Goods 831 627 900 697 222 395 227 032 233 795 228 661 229 519 ¬¬ Services 1 164 079 1 223 653 304 445 309 054 311 218 315 473 317 181 ¬¬ Direct purchases abroad by resident households 170 141 180 669 44 189 45 703 45 222 45 978 43 639 ¬¬ Direct purchases by non-residents -81 556 -99 079 -24 285 -25 122 -26 332 -26 997 -26 807 ¬ Final consumption expenditure of NPISHs 127 875 134 652 33 491 36 414 33 715 33 539 33 110 Final consumption expenditure of general governmen 1 187 108 1 254 975 312 666 316 436 317 614 323 339 326 927 ¬ Final consumption expenditure of central government 608 481 644 767 161 272 162 521 163 199 166 647 168 245 ¬¬¬ Central government, civilian 529 055 553 909 138 586 139 532 139 679 143 074 144 492 ¬¬¬ Central government, defence 79 426 90 858 22 686 22 988 23 520 23 573 23 753 ¬ Final consumption expenditure of local government 578 627 610 208 151 394 153 916 154 415 156 693 158 682 Gross fixed capital formation (GFCF) 1 235 211 1 284 386 321 536 317 302 335 488 311 278 327 488 ¬ Extraction and transport via pipelines (GFCF) 259 345 281 385 73 922 71 110 71 746 65 355 72 127 ¬ Ocean transport (GFCF) 9 405 2 819 736 693 842 182 432 ¬ Mainland Norway (GFCF) 966 461 1 000 182 246 878 245 499 262 899 245 741 254 929 ¬¬ Industries (GFCF) 476 461 504 920 123 865 123 519 133 729 124 103 127 915 ¬¬¬ Services activities incidential to extraction (GFCF) 10 556 10 809 2 072 2 578 4 129 2 945 2 486 ¬¬¬ Other services (GFCF) 317 271 331 784 81 272 80 600 87 248 80 345 81 599 ¬¬¬ Manufacturing and mining (GFCF) 73 244 76 707 18 782 19 593 20 329 18 336 19 053 ¬¬¬ Production of other goods (GFCF) 75 391 85 620 21 739 20 748 22 023 22 477 24 778 ¬¬ Dwelling service (households) (GFCF) 207 290 208 731 51 684 52 114 53 534 53 127 54 613 ¬¬ General government (GFCF) 282 709 286 532 71 330 69 865 75 637 68 510 72 401 Acquisitions less disposals of valuables 311 330 82 85 83 86 86 Changes in stocks and statistical discrepancies 38 275 -19 349 11 205 -531 -36 568 2 353 -13 426 Gross capital formation 1 273 797 1 265 368 332 822 316 856 299 003 313 717 314 148 Final domestic use of goods and services 4 673 070 4 860 935 1 225 724 1 226 373 1 214 236 1 233 710 1 237 718 Final demand from Mainland Norway (excl. changes in stocks) 4 365 734 4 595 749 1 139 779 1 155 016 1 178 132 1 165 734 1 178 500 Final demand from general government 1 469 818 1 541 507 383 996 386 301 393 251 391 849 399 328 Total exports 2 496 349 2 511 847 604 357 612 056 616 662 660 156 712 637 ¬ Traditional goods (export) 671 680 721 874 173 458 181 992 187 113 177 817 186 903 ¬ Crude oil and natural gas (export) 1 169 314 1 099 907 262 496 259 395 254 826 315 849 353 473 ¬ Ships, oil platforms and aircraft (export) 12 115 14 689 3 099 3 018 2 594 3 345 4 684 ¬ Services (export) 643 240 675 376 165 305 167 651 172 129 163 145 167 577 Total use of goods and services 7 169 419 7 372 782 1 830 081 1 838 429 1 830 898 1 893 866 1 950 355 Total imports 1 786 978 1 861 448 457 955 463 420 477 535 466 499 466 931 ¬ Traditional goods (import) 1 036 982 1 082 381 264 927 268 091 280 916 275 947 278 573 ¬ Crude oil and natural gas (import) 20 744 20 554 4 745 4 698 5 053 3 619 6 488 ¬ Ships, oil platforms and aircraft (import) 41 163 23 537 7 062 4 759 4 511 3 360 4 989 ¬ Services (import) 688 089 734 976 181 222 185 872 187 055 183 572 176 881 Gross domestic product, market values 5 382 441 5 511 334 1 372 126 1 375 009 1 353 363 1 427 367 1 483 424 Gross domestic product Mainland Norway, market values 4 191 794 4 397 716 1 098 858 1 106 533 1 111 489 1 124 648 1 135 355 Petroleum activities and ocean transport2 1 190 647 1 113 618 273 268 268 475 241 874 302 719 348 069 Gross domestic product Mainland Norway, basic values 3 717 522 3 909 884 977 457 984 053 987 872 1 006 303 1 017 244 ¬ Mainland Norway excluding general government (GDP) 2 823 977 2 967 826 742 456 746 425 750 478 764 254 773 155 ¬¬ Manufacturing and mining (GDP) 317 339 341 228 89 226 83 714 85 380 79 207 85 308 ¬¬ Production of other goods (GDP) 446 790 471 746 114 943 119 114 120 747 131 228 129 573 ¬¬ Service activities (GDP) 2 059 848 2 154 852 538 287 543 597 544 350 553 820 558 274 ¬ General government (GDP) 893 544 942 058 235 001 237 628 237 395 242 049 244 089 Taxes and subsidies products 474 272 487 832 121 400 122 480 123 616 118 345 118 111 1Figures from 2024 onwards are prelimanry 2Includes oil and gas extraction, transport via pipelines and ocean transport. Explanation of symbolsDownload table as ... - Final expenditure and gross domestic product. Quarter and year. Seasonally adjusted figures. Percentage change in volume from the previous period.Download table as ...Final expenditure and gross domestic product. Quarter and year. Seasonally adjusted figures. Percentage change in volume from the previous period.1
2024 2025 2nd quarter 2025 3rd quarter 2025 4th quarter 2025 1st quarter 2026 2nd quarter 2026 Final consumption expenditure of households and NPISHs 1.3 2.6 0.6 1.2 0.8 -1.2 -0.2 ¬ Household final consumption expenditure 1.3 2.7 0.4 0.8 1.4 -1.3 -0.1 ¬¬ Goods 1.1 5.8 1.6 1.0 3.2 -3.7 0.0 ¬¬ Services 1.3 1.4 0.3 0.5 0.3 0.3 0.0 ¬¬ Direct purchases abroad by resident households 8.1 2.9 -3.0 3.2 0.2 1.6 -2.1 ¬¬ Direct purchases by non-residents 13.7 17.8 3.3 2.6 3.8 0.9 -1.2 ¬ Final consumption expenditure of NPISHs 1.6 2.3 3.3 7.9 -7.6 -0.5 -2.0 Final consumption expenditure of general governmen 1.7 2.4 0.6 0.5 0.6 0.3 0.8 ¬ Final consumption expenditure of central government 2.8 2.5 0.5 0.4 0.3 0.4 0.7 ¬¬¬ Central government, civilian 2.1 1.4 0.1 0.2 0.2 0.3 0.6 ¬¬¬ Central government, defence 8.1 10.2 3.2 1.6 1.2 0.9 1.1 ¬ Final consumption expenditure of local government 0.7 2.2 0.6 0.5 1.0 0.3 0.8 Gross fixed capital formation (GFCF) -1.4 0.8 3.1 -1.1 5.0 -7.2 4.4 ¬ Extraction and transport via pipelines (GFCF) 4.8 7.2 13.6 -1.1 0.8 -11.5 9.9 ¬ Ocean transport (GFCF) -58.3 -72.0 31.1 -2.5 6.3 -75.2 131.9 ¬ Mainland Norway (GFCF) -1.7 -0.2 0.3 -1.1 6.3 -5.8 2.9 ¬¬ Industries (GFCF) 0.7 2.7 -0.2 -1.0 7.8 -6.0 2.5 ¬¬¬ Services activities incidential to extraction (GFCF) 140.8 -0.6 4.8 26.7 54.2 -25.0 -15.7 ¬¬¬ Other services (GFCF) 1.1 1.3 -1.7 -1.9 7.7 -7.3 1.1 ¬¬¬ Manufacturing and mining (GFCF) -1.0 1.5 3.3 4.8 3.8 -8.1 3.6 ¬¬¬ Production of other goods (GFCF) -6.9 10.2 2.1 -5.3 6.2 4.8 9.0 ¬¬ Dwelling service (households) (GFCF) -12.2 -3.6 -0.4 0.3 2.0 -2.2 1.8 ¬¬ General government (GFCF) 3.3 -2.5 1.9 -2.3 6.6 -8.2 4.5 Acquisitions less disposals of valuables 2.8 2.5 -3.6 -2.8 0.0 6.0 -2.1 Changes in stocks and statistical discrepancies -28.5 .. -14.9 -84.5 .. .. .. Gross capital formation -2.6 -4.2 2.4 -3.8 -8.7 6.2 3.2 Final domestic use of goods and services 0.3 0.7 1.1 -0.3 -1.7 1.0 0.9 Final demand from Mainland Norway (excl. changes in stocks) 0.8 1.9 0.5 0.5 1.9 -1.8 0.7 Final demand from general government 2.0 1.4 0.8 0.0 1.7 -1.3 1.4 Total exports 5.8 2.7 0.1 3.7 3.5 -1.8 -0.1 ¬ Traditional goods (export) 3.4 6.1 1.3 3.2 0.3 -2.1 2.1 ¬ Crude oil and natural gas (export) 4.9 0.8 2.9 4.6 5.8 -0.1 -2.9 ¬ Ships, oil platforms and aircraft (export) 30.4 11.8 -48.9 -7.9 -0.7 25.3 37.5 ¬ Services (export) 10.2 2.5 -4.7 2.8 2.7 -5.7 2.6 Total use of goods and services 2.3 1.4 0.7 1.2 0.3 -0.1 0.5 Total imports 5.0 2.6 -0.1 1.1 2.8 -1.5 0.0 ¬ Traditional goods (import) 3.3 3.3 0.6 0.8 4.8 -0.4 0.2 ¬ Crude oil and natural gas (import) -13.9 13.0 -14.0 5.6 8.1 -30.1 48.4 ¬ Ships, oil platforms and aircraft (import) 21.0 -47.3 1.9 -29.5 -25.1 -15.8 51.4 ¬ Services (import) 7.9 4.0 -0.6 2.8 0.3 -2.0 -2.5 Gross domestic product, market values2 1.4 1.1 1.0 1.2 -0.6 0.4 0.7 Gross domestic product Mainland Norway, market values2 0.6 1.7 0.5 0.1 0.2 0.1 0.3 Petroleum activities and ocean transport3 3.9 -1.0 2.6 4.4 -2.8 1.1 1.7 Gross domestic product Mainland Norway, basic values 0.8 1.8 0.5 0.1 0.0 0.2 0.3 ¬ Mainland Norway excluding general government (GDP) 0.4 1.9 0.6 0.1 -0.1 0.2 0.3 ¬¬ Manufacturing and mining (GDP) 0.9 4.0 1.8 -0.3 -0.7 1.0 1.2 ¬¬ Production of other goods (GDP) -1.6 0.6 -0.1 -1.2 -1.8 -0.5 0.0 ¬¬ Service activities (GDP) 0.9 1.9 0.6 0.5 0.4 0.2 0.2 ¬ General government (GDP) 1.9 1.3 0.1 0.1 0.2 0.2 0.5 Taxes and subsidies products -0.3 1.4 0.4 0.3 1.6 -0.4 0.3 1Figures from 2024 onwards are prelimanry 2Gross domestic product is measured at market prices, while value added by industry is measured at basic prices. 3Includes oil and gas extraction, transport via pipelines and ocean transport. Explanation of symbolsDownload table as ...
Detailed tables:

About the statistics
The information under «About the statistics» was last updated 23 February 2023.
See Concepts and definitions in national accounts for explanations.
Valuation
Registration of values: A transaction may be registered at different values, depending on under which circumstances it is registered. Different concepts regarding valuation are also relevant for the general aspect of registration (cf. cash values or accruals values, and other principles for the recording of statistical data). The transactions of variables in the national accounts follow the accrual principle. Thus, taxes and subsidies on production should be registered as accrued values and not as cash values as recorded in the government accounts.
In the description of the transaction of goods and services several price concepts are used. Output is valued at basic prices. Basic price is the price the seller receives, after corresponding taxes on the product are deducted (and subsidies added). The use categories, both intermediate consumption and final use, are valued at purchaser prices, that is the price the purchaser must pay. Exports are valued at fob (free on board), while imports are valued at cif (cost-insurance-freight).
The value added of an industry is "valued" at basic prices (calculated as output at basic prices less intermediate consumption at purchaser prices). The total value added of all the industries is also "valued" at basic prices.
GDP is "valued" at market prices, which means that taxes on products, including VAT, less subsidies on products are added to the total value added of the industries at basic prices.
The accounting system of the Norwegian national accounts is based on the international standards for national accounts, i.e. 2008 SNA and ESA 2010. The accounting system outlines the framework and contents for production of national accounts statistics. The level of detail in the classifications used for compilation of quarterly and preliminary annual national accounts are more aggregated than in that used for calculation of the annual national accounts.
In addition to accounting structure, the international standards give recommendations of groupings or classifications to be used in the national accounts:
Activity classification
The classification of Industries in the National Accounts follows the Norwegian Standard Industrial Classification (SN2007), which is based on NACE Rev.2. Several levels of aggregation have been introduced for publication and reporting purposes.
Classification of non-financial assets and gross fixed capital formation
Non-financial assets are classified by type of aggregates defined in 2008 SNA, such as fixed assets, inventories, valuables, and non-produced assets, including both tangible assets such as land, subsoil-assets, water resources etc., and intangible assets such as transferable contracts etc. Gross fixed capital formation is grouped by main type within building and construction, machinery and equipment and transportation equipment.
Product classification
The product classification used in the national accounts is based on the EU's standard product classification CPA - Statistical Classification of Products by Activity in the European Community. The CPA groups products by activities, i.e. it defines characteristic products within each activity and connects them to the activity classification NACE Rev.2. The annual accounts supply and use tables contain about 700 products, in addition to which some products are also incorporated purely for technical reasons. The system to elaborate preliminary annual and quarterly accounts contains about 90 products. The separation on products might to large extent be considered as a tool to balance the national account system and to undertake calculations in constants prices.
Classification of individual consumption by purpose
The classification of Consumption expenditure groups in the National Accounts is based on the international classification COICOP - Classification of Individual Consumption by Purpose, published by the UN.
Classification of the functions of government
The classification of the functions of government by purpose applies to all types of general government expenses, such as government final consumption expenditure, gross fixed capital formation, subsidies, property rents (i.e. expenses), capital transfers and other transfers for use in government financial accounts and in the national accounts. This classification is based on the international classification COFOG - Classification of the Functions of Government, published by the UN.
Classification of the purpose of non-profit institutions serving households (NPISH)
This is a minor purpose classification which applies to expenses of NPISHs. It is based on the international classification COPNI - Classification of the Purposes of the Non-Profit Institutions Serving Households, published by the UN.
Name: National accounts
Topic: National accounts and business cycles
Division for National Accounts
National level
The monthly national accounts (MNA) are published about 40 days after the end of the given month.
The quarterly national accounts (QNA) are published about 40 days after the end of the given quarter. Quarterly figures are calculated as the sum of three months (from monthly national accounts).
The first estimates of the preliminary year is published about 40 days after the end of the year.
Published figures are reported to Eurostat, the International Monetary Fund (IMF) and the Organisation for Economic Co-operation and Development (OECD).
Not relevant
The national accounts (NA) statistics are designed to provide a consistent and comprehensive survey of the overall national economy. The national accounts give both a summarised description of the economy as a whole and a detailed description of transactions between different parts of the Norwegian economy, and between Norway and the rest of the world. The national accounts also provide information on capital stocks and employment.
The first Norwegian national accounts based on modern principles were published by Statistics Norway in 1952. Annual series national accounts were calculated back to 1865 during the 1950th.
Final annual national accounts figures are based on all available final economic statistics and therefore take time to produce. The purpose of the quarterly national accounts is to provide updated information about short-term developments in the Norwegian economy based on an overall, consistent accounting system. Statistics Norway has produced and released quarterly national accounts (QNA) on a regular basis from 1953 but were not published at fixed intervals from the 1970s to the beginning of the 1980s. A new model for a QNA system was developed at the beginning of the 1980s and has been used since 1985, with some modifications.
National accounts are used as a tool to compare the economic situation in different countries, and therefore it is important that the national accounts in various countries are based on a common template. Staff involved in elaborating national accounts in Statistics Norway participated actively in developing international recommendations and concepts regarding national accounts. The first international standard for national accounts, 1953 System of National Accounts (1953 SNA), was published by UN in 1953.
From time to time adaptations or changes are made to the common international recommendations for national accounts. This requires corresponding changes in the construction of the Norwegian national accounts. At different time intervals, new source statistics are produced and indicate that parts of the national accounts figures need to be revised. Since one objective of the national accounts is to provide a picture of the development over time which is as correct as possible, it is not possible to introduce such changes from one year to another. With different time intervals, it will therefore be necessary to carry out major revisions of the national accounts figures, so-called main revisions, in order to introduce adaptations due to new international recommendations or introduce new levels based on new statistical sources. As part of these main revisions the time series are also revised so that the revised national accounts can give a consistent picture of the economic development over time.
In recent decades, Statistics Norway has carried out main revisions published in 1995, 2002, 2006, 2011 and 2014. The main purpose of main revision published in November 2014, was to incorporate updated international recommendations in 2008 SNA andESA 2010. Changes due to this main revision are described, among else, in the article Main revision 2014. Planned changes in the national accounts statistics. The publication History of national accounts in Norway. From free research to statistics regulated by law also provides more information about the history of national accounts in Norway, including main revisions. In the future main revisions of the national accounts normally will be carried out every five years.
Since the QNA are completely harmonised with the annual national accounts, it is also necessary to revise the QNA figures once the annual national accounts figures have been revised.
The quarterly figures are mostly used for observation and analysis of the current economic cycle. The QNA figures also serve as a basis for making forecasts of the future economic development, the government’s work with the national budget and other economic planning. In addition, the QNA contribute with material for research and development. Annual and quarterly national accounts are a useful tool for analyses of the economic development and structures in Norway. The national accounts are also used to compare the economy in different countries.
The annual and quarterly national accounts therefore have a wide group of users, from school pupils and students to public and private institutions that actively use the statistics in their analyses and investigation of economic structure and development. Active users include the Research Department in Statistics Norway, the Ministry of Finance, Norges Bank, international organisations such as the IMF, the OECD, the World Bank, the UN and Eurostat, resident and non-resident financial sector analysts, and the media.
No external users have access to the statistics and analyses before they are published and accessible simultaneously for all users on ssb.no at 08.00 am. Prior to this, a minimum of three months' advance notice is given in the Statistics Release Calendar. This is one of Statistics Norway’s key principles for ensuring that all users are treated equally.
The monthly figures are the basis for quarterly figures, quarterly figures are calculated as the sum of three months. Quarterly figures will be updated when publishing the third month in the quarter. This means that there may be deviations between the monthly and quarterly figures in the two months before the new quarter is calculated. The deviations will mainly apply to seasonally adjusted figures. In addition, the monthly publication includes a table showing rolling numbers for three and three months. The three-month growth is calculated by comparing a three-month period with the previous three-month period. For example, the volume change in the rolling table for July is given by comparing the period May-July with February-April. Figures for March, June, September and December will correspond to growth for a quarter.
All historical figures are consistent with both preliminary and final annual national accounts figures in fixed and current prices
The Norwegian Balance of Payments (BOP) is an integrated part of the Norwegian system of national accounts, and the BOP figures are fully consistent with other preliminary and final quarterly and annual national accounts figures. Furthermore, quarterly and annual national accounts figures are fully consistent and compatible with the institutional sector accounts. The regional national accounts, and various satellite accounts (environment, tourism, health, non-profit institutions, education) are consistent with the above mentioned national accounts statistics. Previous published figures from the regional accounts and various satellite accounts are, however, not revised as a part of main revision of the national accounts, so figures for previous years may not necessarily be compatible with updated NA time series.
As mentioned in the chapter "Production: Data sources and sampling", the national accounts are based on various statistical sources. The source statistics may not use the same definitions or groupings as used in the national accounts. As a result, figures in the source statistics may be adapted or corrected before being used in the national accounts. Published figures in the source statistics of certain industries may therefore not correspond to published figures in the national accounts.
Not relevant
Regulation (EU) No 549/2013 (ESA 2010).
The European Parliament and of the council of 21 May 2013 on the European system of national and regional accounts in the European Union (text with EEA relevance).
The coverage of the national accounts is defined by international guidelines in the 2008 System of National Accounts (2008 SNA), published by the UN, the OECD, the IMF, the World Bank, and the Commission of the European Communities, and theEuropean System of National and Regional Accounts (ESA 2010).
The total national economy, and the distinction between the national economy and foreign countries, is defined in terms of resident units. A unit is defined as a resident unit of the country when it has a centre of economic interest in the economic territory of the country - i.e. when it is involved in economic activities on this territory for an extended period of time (one year or more).
Two basic types of information are recorded in the national accounts: flows and stocks. Flows refer to actions and effects of events that take place within a given period of time, for example the output of an industry in one year. Stocks refer to positions at a certain point of time, for example the value of capital stock or the number of employed persons.
The national accounts consist of two main sets of tables; supply and use tables (SUT), also described as the real accounts, and the institutional sector accounts. The real accounts are based on local kind-of-activity units (KAUs), while the institutional sector accounts are based on institutional units. Institutional units are economic entities that are capable of owning goods and assets, of incurring liabilities and of engaging in economic activities and transactions with other units in their own right. An institutional unit contains one or more local kind-of-activity units (local KAUs). The local KAUs are classified by type of activity. An activity is characterised by an input of products, a production process and an output of products. All local KAUs engaged in the same or similar kind-of-activity constitute an industry.
The SUT at current and constant prices gives a structured overview of the supply (output and import) and use (final consumption, gross fixed capital formation, changes in inventories, export and intermediate consumption) of products (goods and services) in the economy. For each industry the value added is calculated as the difference between output and intermediate consumption. The value added in an industry can also be decomposed into compensation of employees, consumption of fixed capital, other taxes on production (net of subsidies) and operating surplus. The real accounts also give information on fixed assets, as well as wages, hours worked, full-time equivalent persons and employed persons by industry. Monthly national accounts does not include figures for employment etc..
Furthermore, the real accounts provide the basis for the calculation of the Gross Domestic Product (GDP) and other central macroeconomic measures. The annual growth in volume and price are calculated for most variables.
The non-financial sector accounts are based on institutional units. Institutional units are capable of providing a full set of accounts. The non-financial sector accounts describe all economic transactions in the various sectors. The accounts also provide information on the stocks financial and non-financial capital. Financial sector accounts are also based on institutional units. The institutional units are grouped in institutional sectors on the basis of their principal economic functions, behavior and objectives. The non-financial sector accounts are consistent with the real accounts. The further description of the national accounts covers the part of the national accounts that is based on the annual SUT (the real accounts).
The coverage of the preliminary annual and quarterly real accounts is the same as the final annual SUT
The accounting structure in the system that produces monthly, quarterly and preliminary annual figures (MNA) is, however, more aggregated than in the system that produces the final annual SUT. While the SUT in the annual accounts consists of about 130 industry groups and 700 product groups, the SUT in the MNA consists of about 80 industry groups and 120 product groups. The MNA and QNA system produces tables with seasonal adjusted figures for industries' value added, household consumption for aggregated consumption groups and for central macroeconomic measures. However, only tables for final expenditure and gross domestic product are published on a monthly basis, while the QNA contain more details.
The calculations of the annual real accounts are based on statistics from several different sources, such as the structural business statistics for manufacturing and other industries, accounting statistics for general government and enterprises, statistics for wages and earnings, external trade statistics, household consumer surveys and employment statistics. Some parts of the national accounts are compiled more or less directly from the source statistics, while other parts are based on calculations and estimates.
Monthly information is used for compiling monthly national accounts, such as the production index of industrial production, the index for retail sales, consumer price index, building statistics, producer price indices and much more. For some service industries where we lack explicit production indicators, monthly information about jobs, working days and absence is obtained from the A-ordning. For investments where we only have quarterly information, such as oil investments, quarterly figures are conventionally distributed by month. In the months before we get the so-called oil census, the development is used in the planned investment figures reported together with those performed for a quarter. In connection with the work on the QNA, quarterly information is incorporated and an update of the previous months is made. Quarterly national accounts will appear as the sum of the three months in the quarter.
The source statistics used to calculate national accounts are with a few exceptions produced by Statistics Norway.
Having the reporting responsibility to Eurostat, the Division for National Accounts occasionally documents the calculations for the final annual national accounts, see Norwegian National Accounts - GNI Inventory for ESA95.
In addition, there are a number of reports giving more detailed documentation of calculation of figures for various specific industry groups or other parts of the national accounts (mostly in Norwegian only).
The documentation report for the Quarterly national accounts gives an overview of central sources and methods used for quarterly accounts compilation. This will be updated in the autumn of 2018 to include monthly national accounts.
Compilation of the final annual real accounts
The annual national accounts are mainly based on statistics collected by other divisions in Statistics Norway. To some extent data produced by external suppliers are also used.
The process of compiling the final annual national accounts starts with the calculation of independent supply and use estimates for all goods and services at current prices. To some extent, source data are extracted directly from the databases and converted into national accounts codes and format. Other parts of the economy are based on more complex calculations, by means of different statistical sources and/or assessments.
The source data are critically evaluated and compared with alternative sources (for some parts of the economy). In some areas, the statistics have to be adjusted in order to satisfy the requirements of the national accounts. In areas where the statistics are incomplete, evaluations are essential. In the process of estimating national accounts data, estimated national accounts figures are critically evaluated and controlled in several steps.
Finally, supply and use for each of these goods and services are balanced using supplementary information and quality assessments of the various statistical sources. This results in integrated supply and use tables at current prices.
The figure below gives an outline of the calculation system for final annual national accounts figures. First, detailed figures are calculated and balanced in current prices. Then the system calculates figures in constant prices, based on the detailed current price figures and corresponding price indices. The deflation (current values being divided by price indices) takes place at the most detailed product level: A price index is allocated to each detailed product. The individual products are as price homogeneous as possible. Constant price figures in the annual national accounts are calculated using the price level of the previous year, which means that the base year is changed every
year.
The deflation approach has in fact two dimensions, (i) differentiated by main categories of supply and use (deflating output, imports, exports and implicitly for domestic use), and (ii) differentiated through valuation (deflating current values at basic prices by price indices and implicitly determining the other value components, including adjustments against values at purchaser prices). The method used to calculate constant figures is called double deflation, i.e. a separate deflation of output and intermediate consumption is carried out in order to arrive at value added at constant prices as a balancing item, based on a detailed input-output framework (supply and use tables).
Figure 1. The calculation system for final annual NA figures (Click)
For a more detailed documentation, see Norwegian National Accounts - GNI Inventory for ESA95.
Compilation of the MNA and QNA
The majority of the short-term statistics produced by Statistics Norway are transferred to the MNA system by use of a direct link to the relevant databases. The information in the data sources about growth is used more or less directly in the MNA system. Some other input data series in the MNA system, however, are based more or less on calculations and estimations, using various types of information from Statistics Norway and other sources. Quarterly figures are calculated as the sum of three months
The national accounts data for a specific month, quarter or year are revised in accordance with an ordinary publication and revision cycle. The quarterly figures within a specific year t become final 21 months later after the end of the year t. In addition, periodical main revisions generate revised figures.
In the process of calculating MNA or QNA figures for a specific month or quarter, the short-term statistics source data are critically evaluated and compared with alternative sources (for some parts of the economy). In some cases, the information in the source statistics must be adjusted in order to satisfy the requirements of the quarterly national accounts. In the process to estimate MNA data estimated MNA figures are critically evaluated and controlled in many steps.
Monthly process
The figure below gives an overview of the Norwegian MNA and QNA estimation process. The figure shows that the MNA system is based on two main pillars: a) The SUT for the (final) annual national accounts and b) short-term statistics.
Figure 2. The computing system in the Norwegian MNA/QNA
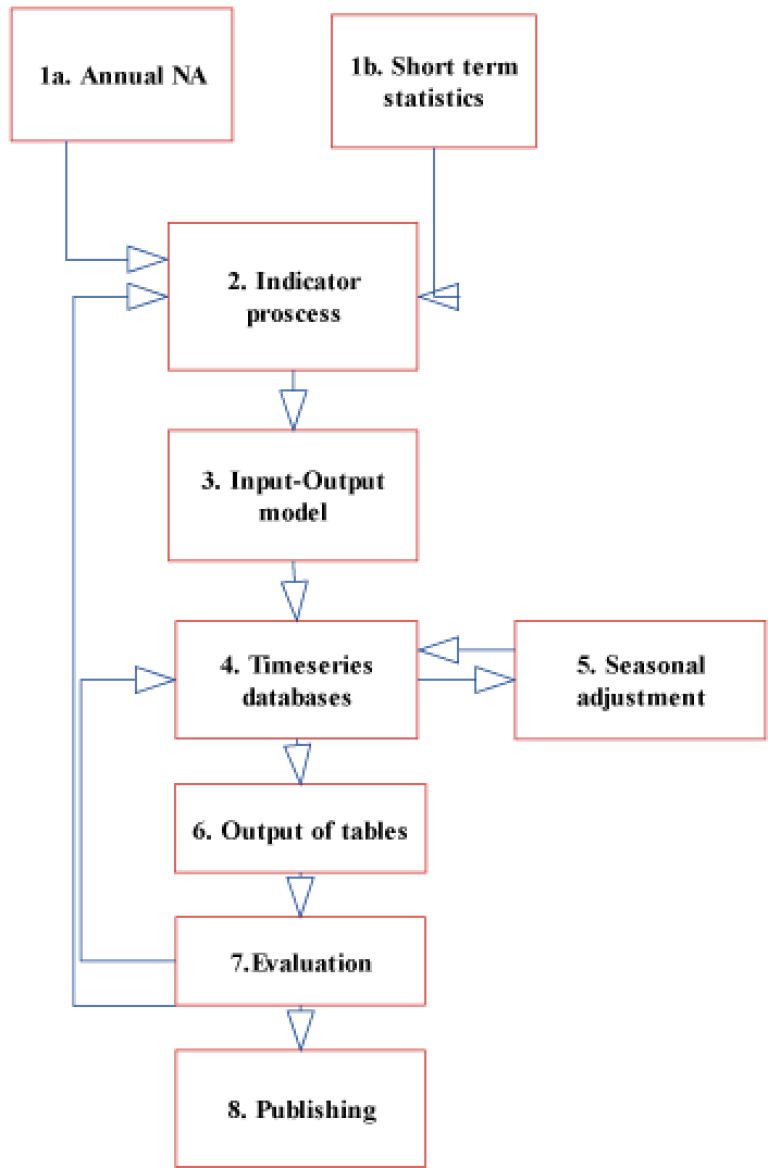
The main principle in the MNA system is that the national accounts figures for the current quarter are computed based on the development of short-term indicators and the current-price figures from the base year. The base year (t-2) is the latest calculated final version of the annual national accounts. The method is the same for most common variables: The value in the base year is given the same growth rate (percentage change) as in the appropriate indicator, or a grouping of different relevant indicators.
A simple projection method, based on the development in previous periods, is used if an indicator does not cover the whole period from the base year to the current quarter.
The indicator compilations are made in the indicator process (box 2 in the figure).
However, the indicator process alone does not give a complete harmonised account at current and constant prices. To calculate values for variables that are not calculated in the indicator compilations, and to harmonise the accounts, we use an input-output model (box 3 in the figure).
The input-output model includes a commodity-flow balance, a price input-output system and a set of equations for summaries and definitions. It now comprises over 12 000 equations in total. The input-output coefficients are calculated from the SUT in the base year. The variables calculated in the indicator compilations are transferred to the input-output model as exogenous variables. To calculate balanced accounts at current prices we need price indices on all supply and use categories. These are computed in the model by weighting together product price indices with the input-output coefficients as weights. Each product gets three different price indices, one for resident output delivered to the home market (to resident users), a second for import and a third for export.
The price index for an industry’s total output is then calculated as a weighted average of the price indices for the home and export market using the input-output coefficients as weights. The price indices of intermediate consumption, final consumption expenditure and gross fixed capital formation are calculated in a similar way, using the import and home market price indices and the input-output coefficients.
The model also calculates variables which are not covered by short-term statistics or other information and therefore not calculated in the indicator process. These calculations are based on simple assumptions. For instance, intermediate consumption for most industries at constant prices (the total except FISIM) is assumed to be a fixed proportion of total output for the relevant industry. The distribution of intermediate consumption (except FISIM) on different products at constant prices is also assumed to be the same as in the base year. The industries’ use of FISIM as intermediate consumption is supposed to equal the growth in total output of FISIM services. Output in the retail and wholesale trade activities in constant prices is assumed to follow the development of the use of the various goods in constant prices, such as household consumption, intermediate consumption and gross fixed capital formation of the various specific goods (that means supposed fixed margins).
Changes in stock of separate products are (for most products) calculated as the difference between the total supply and use of the product. As in the annual NA, the changes in stock may be adjusted if that seems reasonable after an evaluation of the figures.
The results are stored in the time series database (box 4 in the figure), which, among other things, provides the basis for different sets of tables (box 6). At the moment there are two different sets of tables (with seasonal unadjusted figures), sets for internal checks and analyses of data and more aggregated sets of data for publishing.
Process 1-4 describes how the quarterly seasonally unadjusted figures are estimated. The unadjusted figures are seasonally adjusted (box 5) using a seasonal adjustment program.
The method adopted to compile the MNA is highly mechanical. This applies to the update of variables in the national accounts based on short-term statistics as well as the balancing of commodities, the computation of indirect taxes and factor incomes and the overall balancing of the GDP and main aggregates. Technically, the data systems are programmed in FAME and TROLL (the latter is used for the input-output model only).
Checks and/or the evaluation of data are, however, performed in several steps. The MNA system offers a unique opportunity to compare different types of input data. The evaluation of the different sources is done in close contact with the relevant statistics divisions in Statistics Norway. A more thorough evaluation is being done when processing and publishing quarterly figures, while the monthly process is more automated and less profound. Therefore, only final expenditure and gross domestic product are published on a monthly basis while the quarterly accounts offer more details.
Quarterly figures are calculated as the total of three months at quarterly releases. Quarterly figures will be updated only when publishing the third month in the quarter. This means that there may be a mismatch between the monthly and quarterly figures in the interim months. This applies mainly to seasonally adjusted numbers. That is, when you get a new observation (new month), it will normally affect the seasonally adjusted figures back in time. We do not update the QNA numbers that have also been sent to international organizations before the next quarters release. At the same time, we show figures for three-month growth. This is calculated by comparing a three-month period with the previous three-month period. For example, the volume change in July is given by comparing the period May-July with February-April. Figures for March, June, September and December will correspond to growth for a quarter. This means that users may get a continuous update of the quarterly figures by looking at the monthly publication.
Annual process and alignment
The MNA system is updated with a new base year every year (i.e. the latest final version of the annual accounts). The database for the annual accounts (box 1a), as well as the base data and coefficients in the harmonisation model (box 3) are updated. At the same time, it is possible to implement new indicators, carry out changes in the input series and in the model, etc. Such changes are not carried out in an ordinary monthly or quarterly process.
The recalculation of the monthly accounts is carried out by distributing the annual figures between the months using the original monthly figures as keys. The recalculated monthly accounts will then add up to the annual accounts at constant and current prices.
The harmonisation is based on the principle that the differences between the monthly changes to the original and harmonised series shall be as small as possible. The monthly accounts should add up to the figures in the annual accounts.
When the base year is updated the MNA for that year is aligned automatically.
Reference year
All figures are published at current prices and (for most sizes) constant prices (i.e. the accounts also specify volume and price changes). Constant-price estimates in the national accounts are calculated based on the previous year's prices; i.e. the base year is changed every year. Subsequently, data on volume changes are constructed in terms of growth rates and corresponding implicit data on changes in prices. In parallel, time series of volume figures are constructed by using prices from a reference year. The constant-price estimates are consistent with the data on changes in volume in the series of growth rates. Since the chaining is carried out separately for all items, the table components do not, however, necessarily add up to the totals of the same table.
The publication Quarterly national accounts gives more information about sources, methods and the processes used to calculate quaterly NA figures. This will be updated in the autumn of 2018 to include monthly national accounts.
The methods and routines used to produce seasonally adjusted figures are described in the chapter About seasonal adjustment.
§ 2-6 of the Statistics Act states that data under no circumstances shall be published in such a way that they may be traced back to the supplier. This means that the general rule is not to publish data if there are fewer than three enterprises in an industry. In practice, this means that for some detailed industry categories, figures must be aggregated up to a more aggregated industry group before they can be published.
Consistent monthly time series will exist back to 2016. Consistent quarterly time series will exist back to 1978 and annual time series back to 1970. Annual NA figures for the years 1865-1970 are based on the previous standards used for the national accounts and are not compatible with the up to date figures after the latest main revision of the NA.
Quarterly figures are calculated as the sum of three months. Quarterly figures will be updated only when publishing the third month in the quarter. This means that there may be mismatch between the monthly and quarterly figures in the interim months, see the description of the monthly process above.
Monthly figures, and thus quarterly figures, are aligned with the final annual national accounts figures, both in fixed and current prices. The other parts of the national accounts, such as income and capital accounts, and foreign accounts are also consistent and consistent with MNA.
The national accounts are based on various statistical sources. The sources are either survey data from establishments, enterprises or households, or data from registers. National accounts statistics reflect the inaccuracy in the statistical sources and the methods of compilation. Weaknesses and inaccuracy in the statistical sources are normally described in the documentation of the relevant sources.
Since the national accounts are an integrated system with balancing methods and consistency checks, the national accounts may reduce some of the inaccuracies in the statistical sources. On the other hand, national accounts require the compilation of statistics in areas where the sources are unsatisfactory, and the inaccuracy in such areas may therefore be significant. Some of the figures in the national accounts are estimated as residuals, and the uncertainty may be substantial in these areas. Examples are the compilation of changes in inventories and operating surplus by activity.
The EU Commission and Eurostat have completed a quality evaluation of the national accounts in all EEA countries. The conclusion was that "The Norwegian national accounts are of a high quality, soundly based on reliable and exhaustive sources, integrated in a system with a detailed product breakdown". (Report on the sources and methods used in compiling GNP in Norway, Eurostat/B1/CPNB/237/EN, 9 December 1997, Luxembourg.)
The International Monetary Fund (IMF) completed an evaluation of central parts of Norwegian macroeconomic statistics in autumn 2002, including the Norwegian national accounts. In the report IMF (2003), the Norwegian macroeconomic statistics, including the national accounts, got positive reviews: "In summary, Norway's macroeconomic statistics are of generally high quality." About the national accounts, the IMF also expressed that: "The source data for both the annual and the quarterly national accounts are generally sound and timely, and sufficiently portray reality."
The production of several of the sources that are used in the national accounts takes a considerable amount of time. Consequently, preliminary figures are more inaccurate than final figures.
In 2003, Statistics Norway carried out a project to evaluate the quality of the Norwegian QNA. The task of the project was to describe and evaluate the different processes in the system, and set up a plan for further work to improve quality. A project report was released in April 2004 (in Norwegian only). The report lists a variety of measures to increase quality, such as changes in the organisation of the QNA process, technical changes in the data system, an increase and improvement of the documentation related to the QNA system etc.
Another way of measuring the general quality of the QNA figures is to compare the preliminary annual figures from the first version of the annual accounts (by adding up the quarters in the QNA) with the final version. This was done in 2004. The article (in Norwegian only) looks at the growth rates of the main aggregates: GDP, GDP for mainland Norway, household consumption, government consumption, gross fixed capital formation, exports, imports and compensation of employees. For most variables, the study covers the years 1972-2002, while for some variables it covers the years 1993-2002. The study concludes that the preliminary figures generally had underestimated the growth rate in relation to the final figures, but that the overall picture did not differ too much.
The national accounts data for a specific month, quarter or year are revised in accordance with an ordinary publication and revision cycle. The monthly and quarterly figures within a specific year t have the status final 21 months after the end of the year. See Administrative information, Frequency and timeliness. In addition, periodical main revisions give revised figures. See Background and purpose. The table below shows the publication cycle for yearly and quarterly national accounts figures. In addition to what is stated in the table, monthly data will be published about 40 days after the end of the month. In May, year t (which coincides with the QNR for the first quarter), all months, also in year t-1, can be revised. After May year t, only the monthly figures for the current year are subject to revision.
| Publication cycle for quarterly and yearly national accounts figures | ||||
| Release date in: | 1st quarter year t | 2nd quarter year t | 3rd quarter year t | 4th quarter year t |
| May, year t | First preliminary version | Revised 3 for year t-1 | Revised 2 for year t-1 | Revised 1 for year t-1 |
| August, year t | Revised 1 Revised 5 for year t-1 Final for year t-2 | First preliminary version Revised 4 for year t-1 Final for year t-2 | Revised 3 for year t-1 Final for year t-2 | Revised 2 for year t-1 Final for year t-2 |
| November, year t | Revised 2 | Revised 1 | First preliminary version | Revised 3 for year t-1 |
| February, year t | Revised 3 for year t-1 | Revised 2 for year t-1 | Revised 1 | First preliminary version for year t-1 |
Goods sent abroad for processing and merchanting in the Norwegian national accounts. Notater (2015/02)
Process tables in the Norwegian national accounts. Notater (2015/03)
Improved treatment of insurance in the Norwegian national accounts. Notater (2015/04)
Changes in inventories in the Norwegian National Accounts - Accounting data as a source for changes in inventories. Notater (2017/13)
Quarterly national accounts - methods and sources of the quarterly national accounts compilations for Norway December 2013. Notater (2014/02)
Revised national accounts figures 1970-2010
History of national accounts in Norway - from free research to statistics regulated by law. Notater (113)
Norwegian National Accounts - GNI Inventory for ESA95
Norwegian methodology for supply and use tables and input-output tables. Notater (2009/8)
What is seasonal adjustment?
Monthly and quarterly time series are often characterised by considerable seasonal variations, which might complicate inter-period comparability. Such time series are therefore subjected to a process of seasonal adjustment in order to remove the effects of seasonal fluctuations. Once data have been adjusted for seasonal effects by X-12-ARIMA or some other seasonal adjustment tool, a clearer picture of the time series emerge.
For more information on seasonal adjustment, please refer to Statistics Norway’s: metadata on methods: seasonal adjustment.
Because of climatic conditions, public holidays and holidays in July and December, the intensity of the production varies throughout the year. The same applies to household consumption and other parts of the economy.
This makes a direct comparison of two consecutive months or quarters difficult. In order to adjust for these conditions, the quarterly national accounts are seasonally adjusted which makes it possible to conduct an analysis of the underlying change in economic activity between periods.
It is important to mention some factors of the seasonally adjustment of the MNA which has to be given specific attention compared to other short time economic indicators:
- The series for the main aggregates in the MNA is a result of aggregation of many components. Statistics Norway has chosen that consistency between the components and the main aggregates also applies to the seasonally adjusted series to make it easy to identify which series contribute the most to the results.
- Data may be exposed to some revisions each month as well as major revisions when the the preliminary national accounts are reconciled with final national accounts
Background information
- To seasonally adjust the GDP (and all other aggregates) we use an indirect method. This is done in order to be able to explain the contributions to GDP-growth, and consensus is that this is the preferred method for this kind of data. Please see chapter below for more details on the direct vs. indirect approach to seasonal adjustment.
- This method has given us some challenges related to the seasonally adjusted historical series. The reason is that series older than the base year are not additive. When a new base year is established, and the time series are updated, we use identical seasonal adjustment factors as before. This means that changes in seasonally adjusted data are only due to changes in the unadjusted data.
- We use information from the entire period of the time series to estimate seasonal adjustment factors, but we use this information only from the year before the base year to the present.
The method chosen is in accordance with the ESS-Guidelines on seasonal adjustment.
Seasonally adjusted series
Over a thousand series are seasonally adjusted every month. The series are adjusted at a disaggregated level and then summed up to the main aggregates.
The series for gross value added at industry level are adjusted directly, as opposed to being calculated as the difference between production and intermediate consumption.
For final consumption expenditure of households, the series are seasonally adjusted by applying the seasonal factors that are estimated for the index of household consumption of goods (see the documentation for seasonal adjustment of the index of household consumption of goods).
Pre-treatment routines/schemes
Pre-treatment is an adjustment for variations caused by calendar effects and outliers.
- We run a pre-treatment of some series/main series.
Calendar adjustment
Calendar adjustment involves adjusting for the effects of working days/trading days and for moving holidays. Working days/trading days adjustments are made for both the number of working days/trading days and for the varying composition of days from one month to another.
- It is performed calendar adjustments on all series showing significant and plausible calendar effects within a statistically robust approach, such as regression or RegARIMA (a regression model with an ARIMA structure for the residuals).
Methods for trading/working day adjustment
- RegARIMA correction – in this case, the effect of trading days is estimated in a RegArima framework. The effect of trading days can be estimated by using a correction for the length of the month or leap year, regressing the series on the number of working days, etc. In this case, the residuals will have an ARIMA structure.
Correction for moving holidays
- We run an automati correction with X-12-ARIMA. The utomatic correction of raw data will be based on Norwegian holidays.
National and EU/euro area calendars
- Use of the Norwegian calendar with X-12-ARIMA.
Treatment of outliers
Outliers, or extreme values, are abnormal values of the series
- Outliers are detected automatically by the seasonal adjustment tool. The outliers are removed before seasonal adjustment is carried out, and then reintroduced into the seasonally adjusted data.
Model selection
Pre-treatment requires choosing an ARIMA model, as well as deciding whether the data should be log-transformed or not.
Decomposition scheme
The decomposition scheme specifies how the various components – basically trend-cycle, seasonal and irregular – combine to form the original series. The most frequently used decomposition schemes are the multiplicative and additive.
- Manual selection of decomposition scheme after graphical inspection of the properties to the specific series.
Comments: Additive decomposition is used for series with (potential) negative values or values equal zero, otherwise multiplicative decomposition is used.
Choice of seasonal adjustment approach
- X-12-ARIMA
Consistency between raw and seasonally adjusted data
In some series, consistency between raw and seasonally adjusted series is imposed.
- No constraints are applied.
Consistency between aggregate/definition of seasonally adjusted data
In some series, consistency between seasonally adjusted aggregates and its components is imposed. For some series there is also a special relationship between the different series, e.g. GDP which equals production minus intermediate consumption.
- Definitions and relationships that hold for unadjusted figures also apply for seasonally adjusted figures.
Comments: The supply side equals the use side also for seasonally adjusted figures. This implies that changes in stocks/statistical discrepancies are treated as a residual in the seasonally adjusted figures (balancing item). The series for gross value added are adjusted directly (see chapter 1.3) and are not required to match the difference between seasonally adjusted series for production and intermediate consumption (thus, vertical – not horizontal – consistency is imposed).
Direct versus indirect approach
Direct seasonal adjustment is performed if all time series, including aggregates, are seasonally adjusted on an individual basis. Indirect seasonal adjustment is performed if the seasonally adjusted estimate for a time series is derived by combining the estimates for two or more directly adjusted series.
- Mixed indirect approach is applied
Comments: MNA uses aggregation routines outside X-12-ARIMA.
Horizon for estimating the model and the correction factors
When performing seasonal adjustment of a time series, it is possible to choose the period to be used in estimating the model and the correction factors. Correction factors are the factors used in the pre-treatment and seasonal adjustment of the series.
- The whole time series is used to estimate the model and the correction factors
General revision policy
Seasonally adjusted data may change due to a revision of the unadjusted (raw) data or the addition of new data. Such changes are called revisions, and there are several ways to deal with the problem of revisions when publishing the seasonally adjusted statistics.
- Seasonally adjusted numbers are revised in accordance with a well-defined and publicly available revision policy and release calendar.
Concurrent versus current adjustment
- The model, filters, outliers and regression parameters are re-identified and re-estimated as new or revised data become available.
Horizon for published revisions
- The individual series will be revised when seasonal factors are re-estimated. Concerning the main aggregates the period of revisions is limited from the base year to the present.
Comments: This applies as long as the unadjusted figures before the base year remains unchanged. When a new base year is established, and the time series are updated, we use identical seasonal adjustment factors as before. This means that changes in seasonally adjusted data are only due to changes in the unadjusted data.
Evaluation of seasonally adjustment data
- Continuous/periodical evaluation using standard measures proposed by different seasonal adjustment tools.
All series are sufficiently long to perform a seasonal adjustment.
Data availability
- Both unadjusted (raw), seasonally adjusted and sum rolling three months data are available.
Press releases
- In addition to raw data, at least one of the following series is released: pre-treated, seasonally adjusted, seasonally plus working day adjusted trend-cycle series.
- Both levels and growth rates are presented.
- Empirical values are presented to evaluate revisions of data in earlier press releases.
References
Statistics Norway’s metadata on methods: seasonal adjustment
The Committee for Monetary, Financial and Balance of Payments statistics: ESS-Guidelines on seasonal adjustment
EUROSTAT: Seasonal Adjustment. Methods and Practices
US census: X-12-ARIMA-manual
Contact
Relatert innhold
Analyses, articles and publications
 Artikkel / 9 June 2021Low activity in the Mainland Economy continues in AprilGDP in Mainland Norway increased 0.3 per cent in April, adjusted for seasonal variation. The growth follows a downturn lasting all three months of the 1st quarter of 2021.
 Artikkel / 5 June 2019Revision of national accounts time seriesOn 29th August this year Statistics Norway will publish revised national accounts time series. Both the level and the growth rates of GDP are only to a minor extent affected by the revisions.
 Artikkel / 16 April 2012Concepts and definitions in national accountsRead about important concepts and definitions in national accounts.
 Artikkel / 15 May 2013Industries in the National AccountsMain categories of industries used in national accounts.
 Article / 4 December 2025Supply and Use and Input-Output tablesThe supply and use tables give a statistical picture of total supply and total uses for all goods and services in the economy. The input-output tables are derived from the supply and use tables based on the assumption of a fixed product sales structure, and they show flows from each industry to other industries and to final uses.