Content
Published:
This is an archived release.
Strong income growth for the elderly
Pensioner couples have experienced the strongest rise in household income in recent years, while young singles had the weakest rise in income.
The difference between the old and the young in respect to income growth can be found among couples as well as among people living alone. Among singles, people aged 65 years or older had the strongest rise in income. In real terms their median after-tax income grew by 42 per cent between 1990 and 2004. Singles in the ages 45 to 64 had an increase of 36 per cent in the same period, while the youngest age group (students excluded) only had a 20 per cent rise in median income.
The same pattern can be found among couples without children. While the oldest couples had a real growth in after-tax income of 51 per cent, the youngest couples had an income that in real terms was 29 per cent higher than what a similar household type had in 1990. Couples where the oldest person was between 45 to 64 years old had an increase in after-tax income of 36 per cent in the same period.
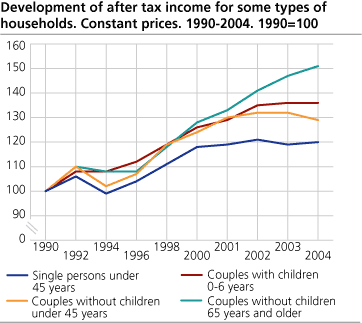
The stronger income growth among the oldest may be explained by the fact that recently retired pensioners have a substantially better pension income and income from property compared to older pensioners. In addition, in particularly pensioner couples have benefited from a strong increase in pension income in recent years. The weaker income growth among the young, on the other hand, may be a result of an aggravated labour marked since 2000.
Norwegian households had an average total income of NOK 478 000 in 2004. Income from work was the largest component, amounting to an average of NOK 331 700. Property income amounted to NOK 40 600, while pensions and benefits were at an average amount of NOK 105 700. Average household after-tax income was NOK 359 300 in 2004.
Greater inequality
If the population is divided into ten income classes of the same size (decile) and sorted by size of household income per consumer unit, we will get a picture of the distribution of household income within the populations. Decile 1 is the tenth of people with the lowest income, while decile 10 is the tenth with the highest income.
The people in the tenth decile received 25.1 per cent of all income in 2004 - an increase of 0.6 percentage point compared to the previous year. Persons in the highest decile had an average income seven times higher than the average income of the ones in the lowest decile. A decade earlier, the richest tenth had less than six times the income of the "poorest" tenth. The rise in income inequality might be due to an increase in capital income, and lower taxes on these incomes. Greater inequality in wages in later years may also have contributed to larger inequality in household income.
Basis of statistics
The basis of the income and property statistics for households is a sample of about 13 000 households. The composition of the households is mapped using interviews and information from registers, while information on income is collected from different administrative registers.
Tables:
- Table 1 Income account for households, by type of household. Average per household. 2004. NOK
- Table 2 After tax income for households, by type of household. 1990-2004. At constant prices. 1990=100
- Table 3 Property account for households, by type of household. Average per household. 2004. NOK
- Table 4 Number of household with debt more than three times total household income by different types of household. 1990-2004. Per cent
- Table 5 Average disposable income per consumption unit (EU scale], by type of household and age of the main income earner. PPP-Euro. 2002. Singles and couples without children in Norway=100
- Table 6 Percentage of people in households with annual after-tax income per consumption unit below different distances to the median income. OECD-scale and EU-scale. 1996-2004
- Table 7 Low-income thresholds for different households (annual income) equal to 50 and 60 per cent of the average median income after tax. 2004. NOK
- Table 8 Distribution of household equivalent income after taxes between persons. (E=0.5). Decile shares and cumulative decile shares. 1990-2004. Per cent
Contact
-
Jon Epland
E-mail: jon.epland@ssb.no
tel.: (+47) 92 61 69 08
-
Elisabeth Løyland Omholt
E-mail: elisabeth.omholt@ssb.no
tel.: (+47) 93 05 55 28
-
Christian Brovold
E-mail: christian.brovold@ssb.no
tel.: (+47) 91 75 31 32
-
Lene Sandvik
E-mail: lene.sandvik@ssb.no
tel.: (+47) 90 13 16 16