Statistikk innhold
Statistics on
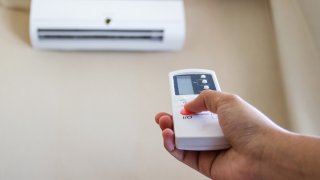
Energy consumption in households
The purpose of the statistics is to present figures for average energy consumption per household for different household types and house types, and to study the development over time. The statistics also comprise combinations of heating equipment in dwellings.
Selected figures from these statistics
- Average energy consumption per household, total and per m² dwelling area. kWhDownload table as ...Average energy consumption per household, total and per m² dwelling area. kWh1
Total energy consumption (kWh) Change in per cent Specific energy consumption (kWh per m² dwelling area) Change in per cent 2012 2022 2012 - 2022 2012 2022 2012 - 2022 Total 20 230 17 518 -13.4 185 154 -16.8 Electricity 16 044 14 964 -6.7 149 131 -12.1 Oil and kerosene 698 0 -100.0 6 0 -100.0 Wood, pellets and wood briquettes2 3 204 2 066 -35.5 27 15 -44.4 1Consumption of district heating and gas is included in the total energy consumption, but is not shown explicitly here. However, figures for this is available in the Statbank, table 10572. 2For 2022, a factor of 4.3 kWh per kilogram is used for the energy content of firewood, whereas this factor was previously 4.67 kWh per kg. The actual decrease in firewood usage from 2012 to 2022 is approximately 30% (in total) and 38 % (for specific consumption) when accounting for the changed factor. Explanation of symbolsDownload table as ... - Average energy consumption by product and per household. kWh supply of energyDownload table as ...Average energy consumption by product and per household. kWh supply of energy
1994 1995 2001 2004 2006 2009 2012 2022 Total1 23 525 23 633 22 399 21 143 21 644 20 415 20 230 17 518 Electricity 18 436 18 537 17 779 15 991 16 240 15 977 16 044 14 964 Oil and kerosene 1 718 1 908 1 217 1 562 1 411 845 698 0 Wood, pellets and wood briquettes2 3 274 3 105 3 331 3 504 3 853 3 407 3 204 2 066 1Figures for consumption of district heating and gas is included in "Total" and is shown explictly in Statbank table 10572. 2Up to and including the 2009 survey, some consumption of coal and coke was also included under the category 'firewood, pellets, and wood briquettes". Explanation of symbolsDownload table as ... - Average energy consumption by product, per m² dwelling area. kWh supply of energy. Time seriesDownload table as ...Average energy consumption by product, per m² dwelling area. kWh supply of energy. Time series
1994 1995 2001 2004 2006 2009 2012 2022 Total1 212 211 203 186 190 181 185 154 Electricity 169 169 164 145 147 146 149 131 Oil and kerosene 15 15 11 13 12 7 6 0 Wood, pellets and wood briquettes2 27 26 28 27 30 27 27 15 1Figures for consumption of district heating and gas is included in "Total" and is shown explicitly in Statbank table 10572. 2Up to and including the 2009 survey, some consumption of coal and coke was also included under the category 'firewood, pellets, and wood briquettes". Explanation of symbolsDownload table as ...

About the statistics
The information under «About the statistics» was last updated 24 July 2025.
Income :
The information is taken from tax assessment registers. Income is calculated as pensionable earnings - assessed taxes + tax deductions.
Household
A household consists of all persons living in the same dwelling and eating at least one meal together every day. Persons who are temporarily absent due to school; vacation, admission to hospital, military service etc. are included.
Region:
The various regions used up to and including the 2012 survey consist of the following counties:
Oslo
Akershus
Hedmark and Oppland
South-Eastern Norway (Østfold, Buskerud, Vestfold and Telemark)
Agder and Rogaland (Aust-Agder, Vest-Agder and Rogaland)
Western Norway (Hordaland, Sogn og Fjordane, Møre og Romsdal)
Trøndelag (Sør-Trøndelag and Nord-Trøndelag)
Northern Norway (Nordland, Troms and Finnmark)
For 2022, the statistics are published both by county and by region.
Counties for 2022 is described here: https://www.ssb.no/klass/klassifikasjoner/127/versjon/2115/koder
The regions for 2022 consists of the following counties:
Oslo and Viken (2020-2024)
Innlandet (2020-2024)
Agder and South-Eastern Norway (2020-2024) Agder, Vestfold and Telemark
Western Norway (2020-2024) Rogaland, Vestland, Møre og Romsdal
Trøndelag (2020-2024)
Northern Norway (2020-2024) (Nordland and Troms and Finnmark)
Unknown region (Not in use)
This is based on "nuts2" for 2022, which is described here:
https://www.ssb.no/klass/klassifikasjoner/508/versjoner
House type:
The classification of house types is the following:
Farming houses
Detached houses
Row houses/semi-detached houses (row houses, chain housing, two, three, four family houses etc.)
Blocks of flats etc. (large houses with many dwellings and combined dwelling and office / industrial buildings)
Different housetypes is described more in detail on point 1-dwelling here:
https://www.ssb.no/klass/klassifikasjoner/31
The energy consumption figures is measured in kWh
Name: Energy consumption in households
Topic: Energy and manufacturing
Division for Energy, Environmental and Transport Statistics
The results are mainly on national level. In addition, tables are available on regional level and also by county for 2022.
The survey has been carried out for the years 1993-1995, 2001, 2004, 2006, 2009, 2012 and 2022, for years where Statistics Norway has carried out the Survey of Consumer Expenditure. The survey was earlier carried out every third year. In 2022 it was 10 years since the last time. This is due to that the Survey of Consumer Expenditure, which is the main source for this survey, neither was carried out for the period 2013-2021. The survey is usually published 1.5-2 years after the reference period. For 2022, the survey was published 2,5 years after the reference period, due to new methods and data sources, such as electricity data from Elhub.
Not applicable
Collected and revised data are stored securely by Statistics Norway in compliance with applicable legislation on data processing.
Anonymized files from the Survey of Consumer Expenditure are already available to researchers and students through Sikt - the Knowledge Sector’s service provider.
In this survey on household energy consumption, some additional information has also been linked. This includes, for example, some additional housing variables, as well as data from Elhub, electricity prices, temperature data, and so on. This dataset, combined with the supplementary information, is also planned to be made available on SIKT.
The system for assuring the quality of Norwegian official statistics is based on quality requirements in the Statistics Act and in the European Statistics Code of Practice.The annual report on the quality of official statistics assesses compliance with the quality requirements for all official statistics as a whole.
The National programme for official statistics sets the framework for the areas Statistics Norway and other public authorities produce statistics on. The programme defines and outlines official statistics.
Further information about the system for quality in official statistics can be found at ssb.no
The purpose of the statistics is to present figures for average energy consumption per household for different household types and house types, and to study the development over time. This shows how the energy consumption varies between different types of households and indicates what kind of factors influence the households' energy consumption. The statistics also comprise information about heating equipment in the households. For some years, it is published statistics for combinations of heating equipment in dwellings, which give an indication of the energy flexibility in households or the households' possibility to switch between different energy sources. Using the survey of consumer expenditure as a basis, we have access to a large amount of relevant background information. This facilitates studies of correlations between energy consumption and relevant factors such as house types, dwelling area, number of persons in household, income etc. The survey can also be used to study the effect on energy consumption of heat pumps by comparing similar households with and without heat pumps. In addition, questions about other energy efficiency efforts (in 2001, 2006, 2009, 2022) enable the study of the extent and effects of such efforts in the households.
The survey was first time carried out for 1993 and then repeated for 1994, 1995, 2001, 2004 2006, 2009,2012 and 2022. A similar study of energy consumption in households was conducted by Statistics Norway for 1990, but other sources and methods were used in that survey. The results for 1990 are therefore not directly comparable with the results for the other years. For 1990, 2001 and 2006 the data were also used in analyses of the average share of electricity consumption for different purposes such as cooking, space heating, water heating etc. The research department in Statistics Norway was responsible for these analyses.
For years prior to 2022, a supplementary energy questionnaire was added to the main questionnaire. This additional questionnaire has previously been funded by NVE, Enova, and/or the Ministry of Energy
The statistics are among other things used as background information in energy reviews/reports in ministries, in various types of research, in the Norwegian Water Resources and Energy Directorate, and in Enova (a public enterprise which works towards more efficient and environmentally friendly energy consumption). The data and results are used for research purposes on the Research Department in Statistics Norway, and in work with energy indicators for households. There is also a lot of public interest in the results.
No external users have access to statistics before they are released at 8 a.m. on ssb.no after at least three months’ advance notice in the release calendar. This is one of the most important principles in Statistics Norway for ensuring the equal treatment of users.
Figures for all households total electricity consumption are published in the monthlly and annual electricity statistics
The electricity statistics is used as a source for electricity consumption in households in the energy balance, which gives data for the total energy consumption in households. The energy balance are published annually, usually in June.
Of the energy balance tables, Statbank table 13929 is specially dedicated for figures for energy consumption in households.
By multiplying results for energy consumption per household from the household survey with the number of all households (from the family and housing statistics) we use to get similar figures as in the energy balance. However, there are some differences because the data sources and methods for calculating these figures not are the same in these statistics.
The survey is voluntary for households. The data for electricity consumption were previously collected from the households' electricity supplier pursuant to §2-2 and 2-3 of the Statistics Act. (the previous statistics act)
For 2022, data from Elhub is linked to the householdsdata. Data from Elhub is mainly collected for the purpose of developing monthly and annual electriciy statistics. This statistics are developed, produced and disseminated pursuant to Act no. 32 of 21 June 2019 relating to official statistics and Statistics Norway (the Statistics Act).
Not applicable
In the statistics bank, comparable figures are available for some years in the period 1993-2022
The statistics are based on a sample survey where the household is the statistical unit. Households are defined as cost households, meaning that the household consists of persons who have a common address and food budget.
See also "About the statistics- Production" to the Survey of Consumer Expenditure which is the main source for this survey.
The source is the annual survey of consumer expenditure and related information from registers on income. For years when energy surveys have been conducted, the survey of consumer expenditure has been supplemented with additional questions on energy consumption and heating equipment in order to give a better basis for statistics and analyses of the energy consumption in households. Data for electricity consumption are collected from the households' electricity supplier up to, and including the 2012-survey.
For 2022 the questions about energy and heating equipment was a part of the main questionnare used for the Survey of Consumer Expenditure. For 2022, electricity data from Elhub was linked to the household sample on basis of dwelling address or social security number of the persons in the household.
In the 2009 survey, it was collected additional data from households that had a heat pump. In addition to electricity consumption for 2009, we collected consumption data for the year when the heatpump was installed, and the consumption before and after the installation year. The purpose was to compare the electricity consumption before and after the installation of a heet pump.
The survey of consumer expenditure was earlier based on personal interviews and detailed accounting in a representative sample of about 2 200 households up to, and including the 2009-survey. For 2004, 48 per cent of the households did not respond, and the net sample became 1 148 households. The tables for combination of heating equipments in dwellings are based on information from all 1 148 households, while the tables for energy consumption are based on information from a somewhat smaller sample of 1 091 households. The smaller sample is due to that households are excluded from energy calculations if important data for energy consumption or background information about dwelling area, year of construction etc. are missing.
For 2006, tables for heating equipments are based on answers from 1027 households, while results for energy consumption are based on answers from 1010 households. This accounts for 47 and 46 per cent of the gross sample respectively.
For 2009, tables for heating equipment are based on data from 1155 households, while the figures for energy consumption is based on answers from 1131 households. This corresponds to 53 and 51 per cent of the gross sample respectively.
For the survey in 2012, the sample was three times higher than earlier, on about 7000 households, but only about 48 per cent of these responded. The net sample used for energy calciulations was 3221 households, while the net sample used for calculations of heating equipment was 3346 households.
The survey for 2022 is based on answers from 3507 households. For this survey, the gross sample was 12000 households, where 11905 households were in the target population. This means that the response rate became only 29.5 per cent. The drop in response rate is probably due to a change in data collection, from interviews by using phone / visit to an electronic web questionnaire and and using an app on the phone to register purchases. The drop in responses was expected, so this is why the gross sample was increased compared to earlier surveys.
For 2022, the whole net samle on 3507 households, is used in the calculatons of energy consumption and the statistics for heating equipment.
See also "About the statistics" for the Survey of Consumer Expenditure
Computer Assisted Personal Interview (CAPI) and detailed accounting for a period of 14 days. Data from the electricity plants were collected in questionnaires by post, or electronically in excel sheets, until and including the 2012 survey.
For 2022 data from Elhub is used as a source for the households electriciy consumptin.
The survey of consumer expenditure was earlier carried out once a year, while the questionnaire on energy and heating equipment only was added if a separate energy consumption survey for households would be carried out . We have not measured how long it takes to answer the additional energy questions or how long it takes the electricity plants to fill in sales figures (in kWh) for electricity to the households. The response burden for individual electricity plants depends on how many households they have to provide information on. In general, the burden becomes larger for large electricity plants with many subscribers.
Revisions and controls of data from the additional questionnaire on energy are done in the data processing programs. The data processing and calculations are done in SAS, a software specially developed for preparing statistics. The software contains some automatic controls that reveal extreme figures. Some obvious errors are corrected automatically in the software, while others require specific treatment. If the energy data for a particular household are not sufficient to calculate the energy consumption, the household is excluded from the energy calculations.
Editing is defined here as checking, examining and amending data.
See also "About the statistics" for the survey of consumer expenditure: http://www.ssb.no/english/subjects/05/02/fbu_en/
For 2004, 92 per cent of the respondents gave Statistics Norway permission to collect data on their electricity consumption from the electricity plant. For the 2004 survey, Statistics Norway collected the electricity consumption from the grid supplier, while information about the type of electricity contract are collected from the power supplier. Information about electricity contract type is collected for research purposes only, for instance price elasticity on electricity. Data from the electricity plants are collected pursuant to the Statistics Act and thus the response rate is very high. However, in some cases the electricity plant is unable to find the household in their register, for instance because the subscriber's name is incorrect or the questions are sent to the wrong electricity plant. As a result, we do not receive data for all households who have given StatistiCS Norway permission to collect data from their plant.
For 2004, the electricity consumption is based on information from electricity plants covering 90 per cent of the households in the sample. However, for various reasons some of the plants have only supplied the consumption for parts of the year, for instance for ten months. In such cases, the consumption is converted to annual consumption on the basis of a profile that shows the percentage distribution of average electricity consumption by month. For 81 per cent of the households, the electricity consumption provided by the plant covered the whole year (for 2004).
For 2006, about 90 percent of the households gave their permission to Statistics Norway to collect electricity consumption from their electricity plant. We received data from the electricity plant for most of these households. However, also for 2006, we had to make some adjustments of these data, in cases where the plant reported data for another period than the calendar year 2006. In cases where data for the electricity plant were totally absent, the electricity expenses, reported by the households, are used as a source for the electricity consumption
For 2009, 1000 households, corresponding to 88 per cent of the households, permitted Statistics Norway to collect electricity consumption from their electricity plant. For the remaining households, and for those where we of other reasons not have received information from the electricity plant, we have used data for the households expenditures to electricity, if it appeared to be reasonable.
The survey of consumption expenditure contains information on household's expenses and demand for (in tonnes or m3 ) fuel wood, heating oils and kerosene for the last 12 months for dwellings and cottages/holiday houses. We only ask about electricity expenses, not the quantity in kWh. For households where the consumption data from the electricity plant are missing, the electricity consumption is calculated on basis of the households' expenses for electricity in the last 12 months. The household's own reporting of expenses is less reliable than data from the electricity plant. In cases where this figure seems to be wrong and other information about the household's energy consumption is missing, the household is excluded from the energy calculations. Because the interviews of the households takes place throughout the year, the consumption refers to parts of two calendar years (partly 2011 and partly 2012 for the 2012 survey). This is also the case for consumption of fuel wood, oil and kerosene that are calculated on basis of purchases, in physical or monetary units, to these energy sources the last 12 months.
In cases where the consumption is calculated from the expenses, the expenses are divided by an average price for the energy source for the relevant period (average price for 2008-2009 for the 2009-survey).
For 2022, it is only collected annual expenses to different energy sources, except from those who produce their own fuelwood and cannot estimate a value for this. For these households, the quantlty of fuelwood is collected in bags etc. Expenses to electricity was collected for the last month, but this is used to calculate annual expenses for 2022. This is again converted to kWh consumption for 2022 by dividing on an individual elecitricty price for each household.
In the survey of consumer expenditure, data on expenses for energy sources for dwellings and cottages/holiday houses are collected gathered. The consumption in cottages/holiday houses is collected in the additional questionnaire on energy and then subtracted from the energy consumption, as the survey only comprises energy consumption in permanent houses.
The statistics for combinations of heating equipment are calculated on the basis of information that is collected in the additional questionnaire on energy. For some households, the information about energy consumption and heating equipment does not correspond to each other. For example, some households report consumption of wood, but not wood stove. In such cases we have assumed that the household has forgotten to report all types of heating equipment, and have therefore corrected the heating equipment accordingly. For 2022 this is more consistent because energy consumption data is collected on basis of what the households responds on the questions about heating equipment.
For 2022, electricity consumption for 2,813 households, that is, 80 percent, is based on data from Elhub. If Elhub data is unavailable or uncertain, such as when the household does not have its own electricity meter or cannot be identified in Elhub, self-reported electricity costs for the most recent month are used instead. These monthly costs are converted into annual electricity expenses using a consumption profile (based on how consumption and costs typically vary throughout the year). Annual electricity consumption is then estimated by dividing the annual expense by a weighted average electricity price for the household over the year. Information about household characteristics, such as dwelling size, housing type, etc., is also used to validate the calculations of electricity costs and consumption. Monthly spot prices for electricity are linked to each household based on location. To calculate the total electricity price for the household, taxes and grid fees are added, while electricity subsidies are deducted.
Not relevant
SN has worked out guidelines for coupling of different data sources for statistical purposes. The guidelines are based on SNs authorisation given by the Data Inspectorate for person registers, and the Statistics Act. According to these guidelines responses given in surveys can only serve for the purpose of making statistics. i.e. information concerning groups of people will be given, not for individuals. When survey data files are coupled to registers, encryption techniques are used in order to ensure that it is impossible to identify persons from the survey or register information in the coupled data file.
In connection with a report which where written in 2005 about energy consumption in household, it was undertaken a retrograde revision of the results from the household surveys, where the same methods were used to correct the data for biases in the sample. The purpose was to obtain comparable results over time.
For the years 1993-1994 and 1995 it was originally used other methods and data sources to correct for biases in the sample. The results were presented in a report which was published in 1999. This report shows somewhat different results compared to results that were presented later on. For 2001, it was originally corrected for size of dwelling area, in addition to household size and house type. However, this was not done in the revised figures, because it came to light that the definition of dwelling area was somewhat different in the consumer expenditure survey and the Population and housing census, which is used as a key for the right distribution.
For 2006, the consumption of fuel wood and kerosene in cottages /holiday houses are included in the households energy consumption, while this is deducted in consumption figures for earlier years. To obtain a comparable development between 2004 and 2006, the 2004-figures were calculated again, including consumption of fuel wood and kerosene in cottages. The timeserie tables in the publication of results for 2006 show by this two sets of consumption figures for 2004, both including and not including consumption of fuel wood and kerosene in cottages.
For 2022, a different conversion factor was used to calculate firewood consumption from kilos to kWh compared to previous years. This is due to a change in the firewood conversion factor in the Energy Balance, effective from the 2025 publication year and retroactively applied. The firewood factor used in the 2022 survey is 4.3 kWh per kilo, whereas the previous factor was 4.67 kWh per kilo. As a result, firewood consumption appears about 8 percent lower compared to using the old factor. Firewood consumption in previous survey years has not been recalculated using the new factor
In the questionnaire used in the survey of consumer expenditure, we ask about expenses for energy in the last 12 months, not the actual consumption. Wood, oil and kerosene can be stored and are not always consumed the same year as they are purchased. The calculated energy consumption may therefore differ from the actual consumption. We have assumed that this evens out between the households, and that it has no consequence for the calculated total energy consumption on average. However, this might lead to errors in detailed tables where the energy consumption for certain groups are based on a small sample of households. Errors might also occur if the households not remember, or do not have any information on how much they have purchased of the different energy sources during the last 12 months. Furthermore, errors can occur from incorrect recording of household answers.
Households that have common central heating and pay for their use of energy through the rent, normally have limited information about their energy consumption. This is because many of them do not have an electricity meter, or they have a meter that only covers parts of the consumption. The electricity plants are usually unable to provide information about the electricity consumption in these cases. Thus special calculations are made for these households, among other things based on expenses for energy consumption in the rent if available. The consumption is divided between electricity and oil.
For households that use district heating, the energy expenses in the rent are converted to district heating consumption, or special calculations are made based on other information. Consumption of district heating is not given as a separate figure in the tables, because few households in the sample use district heating, and they seldom know how much they have used. The district heating plant usually cannot provide this information for individual households because they make deliveries to a central heating system in a housing cooperative. The calculations for district heating consumption are therefore uncertain. However, calculated consumption of district heating is included in the figures for total energy consumption per household. District heating makes up a small share of the energy consumption in households, and is not a big source of error.
For 2022, it is asked about the households expenses to district heating per year, and this is mainly used to estimate this consumption.
For 2004, 48 per cent of the households did not respond. For 2006, the non-response-rate was 53 per cent while the non-response-rate for 2009 was about 47 per cent.This also includes questionnaires that were too insufficient filled in to be used for statistics purposes.
The non-respondents are not evenly distributed among all household groups, and this implies that the distribution by household category does not become representative for the total population. In order to correct sample bias, corrections have been made for non-response. Household groups with a high non-response rate get a high weight when estimating average figures. The non-response rate is particularly high among one-person households. As a result of this, they get a higher weight than the other households in the sample.
Variables that have been used in the correction of bias in the sample are household size (1,2,3,4 and more than 4 persons) and three house types (detached house/farming house, row house/semi-detached house and flat). The source for the correct distribution of household size and house types is the Population and Housing census for 1990 and 2001 and the family and housing statistics combined with the housing register, that started in 2005. The distribution for 2004 is interpolated on basis of data for 2001 and 2005, while the family and housing statistics is used directly as a source for right distribution for the 2006- and 2009-survey.
For 2022, the nonresponse weights calculated and used in the Consumer Expenditure Survey have also been applied in the energy calculations, since the same sample was used. We have also calculated weights in the same way as for previous years, and these yield similar results. However, we have chosen to use the weights from the Consumer Expenditure Survey, as they take more variables into account and do not lead to any significant differences in the results. Therefore, this will not cause a break in the time series compared to previous surveys
Even if the data are weighted, there may still be biases in distributions of certain variables, as age, region etc. that influence the results. Of tehnical reasons, it is not possible to correct for all kinds of biases. We have chosen to weight the data on basis of household size and house type, because these variables are some of the most important for the energy consumption. However, the correction that is undertaken can also correct for other biases. It is for instance a connection between age and household size, and correction of household size can by this also make the agemix in the sample more representative.
Other errors that can occur is for instance if the electricity plants not have real meter readings from the households, and report stipulated figures instead of. Normally, data from the electricity plants is much better than the households' own reporting, even if it is stipulated.
A revision is a planned change to figures that have already been published, for example when releasing final figures as a follow-up to published preliminary figures. See also Statistics Norway’s principles for revisions.
This has not been relevant for this statistics.
Not relevant
https://www.ssb.no/energi-og-industri/artikler-og-publikasjoner/energibruk-i-husholdninger-1930-2004-og-forbruk-etter-husholdningstype
Contact
Relatert innhold
Analyses, articles and publications
 Artikkel / 14 July 2014Large increase in the use of heat pumpsIn 2012, 27 per cent of all households had a heat pump, which is 9 percentage points more than in 2009. In particular, it is households in detached houses and farmhouses that invest in a heat pump. The survey also shows a downward trend in energy use per household.