Content
Published:
This is an archived release.
4 577 457 residents in Norway
The final figures for the population in Norway show that 4 577 457 persons were residents in the country at the beginning of 2004. This is 25 200 more than at the same time in 2003, and an increase by 0.55 per cent. In 2002 the population increased by 0.62 per cent.
Akershus and Rogaland had the highest population increase
The population increased in 2003 except in Finnmark and Sogn og Fjordane. Finnmark had a population decline by about 300, while the decline in Sogn og Fjordane was only 50 persons. During past years both these counties have had high out-migration. In addition Sogn and Fjordane had a low proportion of those aged 20-44 and a high proportion elderly. Akershus had the largest population increase by 1.1 per cent, followed by Rogaland with an increase of 1.0 per cent and Oslo 0.9 per cent. These counties have had net in-migration in the latest years, and at the same time they have a young population. A result of a young population is increased birth surplus due to more births and fewer deaths.
Many young adults in Oslo
Oslo had most persons aged 20-44, counting almost 43 per cent of the population. Hedmark had fewest in this age group with 31 per cent, while the average for the entire country was slightly below 35 per cent.
Rogaland, Akershus and Vest-Agder are the counties with the highest proportion of children younger than 15 years. Hedmark, which has a high percentage of elderly, has the lowest proportion of children aged 0-4 years. Compared with the other counties, Oslo has the highest proportion of children below 1 year of age with 1.5 per cent, and the lowest proportion of children aged 6-15 years. This may indicate that many people move from Oslo after they get children. Particularly Akershus had a high percentage of children in this age group.
Hedmark had the highest proportion of people older than 80 years of age with 5.6 per cent. Sogn og Fjordane, Oppland and Telemark also had a large percentage of people in this age group compared with the other counties. Finnmark had the lowest proportion by 3.3 per cent.
|
Municipalities with more than 40 000
inhabitants 1 January 2004 and population growth 2003 in per cent |
|
Population
1 January 2004 |
Population
growth 2003. Per cent |
||||||||||||||||||||||||||||||||||||||
|---|---|---|---|---|---|---|---|---|---|---|---|---|---|---|---|---|---|---|---|---|---|---|---|---|---|---|---|---|---|---|---|---|---|---|---|---|---|---|---|
| 0301 Oslo kommune | 521 886 | 0.87 | |||||||||||||||||||||||||||||||||||||
| 1201 Bergen | 237 430 | 0.85 | |||||||||||||||||||||||||||||||||||||
| 1601 Trondheim | 154 351 | 1.08 | |||||||||||||||||||||||||||||||||||||
| 1103 Stavanger | 112 405 | 1.26 | |||||||||||||||||||||||||||||||||||||
| 0219 Bærum | 103 313 | 0.76 | |||||||||||||||||||||||||||||||||||||
| 1001 Kristiansand | 75 280 | 0.93 | |||||||||||||||||||||||||||||||||||||
| 0106 Fredrikstad | 69 867 | 0.84 | |||||||||||||||||||||||||||||||||||||
| 1902 Tromsø | 61 897 | 1.17 | |||||||||||||||||||||||||||||||||||||
| 0602 Drammen | 56 688 | 0.43 | |||||||||||||||||||||||||||||||||||||
| 1102 Sandnes | 56 668 | 1.68 | |||||||||||||||||||||||||||||||||||||
| 0220 Asker | 50 651 | 0.72 | |||||||||||||||||||||||||||||||||||||
| 0806 Skien | 50 507 | 0.47 | |||||||||||||||||||||||||||||||||||||
| 0105 Sarpsborg | 49 423 | 0.77 | |||||||||||||||||||||||||||||||||||||
| 1804 Bodø | 42 745 | 1.33 | |||||||||||||||||||||||||||||||||||||
| 0231 Skedsmo | 41 359 | 1.68 | |||||||||||||||||||||||||||||||||||||
| 0706 Sandefjord | 40 992 | 0.73 | |||||||||||||||||||||||||||||||||||||
| 0709 Larvik | 40 990 | 0.28 | |||||||||||||||||||||||||||||||||||||
| 1504 ålesund | 40 001 | 0.77 | |||||||||||||||||||||||||||||||||||||
The largest municipalities had population growth
All municipalities with more than 40 000 inhabitants recorded a population increase during 2003. The increase was highest in Sandnes and Skedsmo by 1.7 per cent, followed by Bodø and Stavanger, by 1.3 per cent.
|
The 20 municipalities with the largest population growth1 in 2003. Per cent |
The 20 municipalities with the largest population decrease
in 2003. Per cent |
||||||||||||||||||||||||||||||||||||||
|---|---|---|---|---|---|---|---|---|---|---|---|---|---|---|---|---|---|---|---|---|---|---|---|---|---|---|---|---|---|---|---|---|---|---|---|---|---|---|---|
| 1252 Modalen | 5.78 | 2023 Gamvik | -5.89 | ||||||||||||||||||||||||||||||||||||
| 0235 Ullensaker | 3.72 | 1755 Leka | -5.36 | ||||||||||||||||||||||||||||||||||||
| 0941 Bykle | 3.18 | 2028 Båtsfjord | -4.74 | ||||||||||||||||||||||||||||||||||||
| 0831 Fyresdal | 2.82 | 1151 Utsira | -4.02 | ||||||||||||||||||||||||||||||||||||
| 0719 Andebu | 2.69 | 2002 Vardø | -4.01 | ||||||||||||||||||||||||||||||||||||
| 1247 Askøy | 2.40 | 1633 Osen | -3.83 | ||||||||||||||||||||||||||||||||||||
| 1159 ølen | 2.15 | 1856 Røst | -3.74 | ||||||||||||||||||||||||||||||||||||
| 0111 Hvaler | 2.13 | 1853 Evenes | -3.35 | ||||||||||||||||||||||||||||||||||||
| 1243 Os | 1.98 | 1839 Beiarn | -3.11 | ||||||||||||||||||||||||||||||||||||
| 0238 Nannestad | 1.97 | 2024 Berlevåg | -2.93 | ||||||||||||||||||||||||||||||||||||
| 0612 Hole | 1.94 | 1842 Skjerstad | -2.92 | ||||||||||||||||||||||||||||||||||||
| 1121 Time | 1.93 | 1874 Moskenes | -2.88 | ||||||||||||||||||||||||||||||||||||
| 1432 Førde | 1.82 | 1928 Torsken | -2.86 | ||||||||||||||||||||||||||||||||||||
| 0234 Gjerdrum | 1.78 | 1418 Balestrand | -2.86 | ||||||||||||||||||||||||||||||||||||
| 0935 Iveland | 1.77 | 1524 Norddal | -2.84 | ||||||||||||||||||||||||||||||||||||
| 1939 Storfjord | 1.76 | 1526 Stordal | -2.82 | ||||||||||||||||||||||||||||||||||||
| 0938 Bygland | 1.70 | 1859 Flakstad | -2.82 | ||||||||||||||||||||||||||||||||||||
| 1102 Sandnes | 1.68 | 1849 Hamarøy | -2.80 | ||||||||||||||||||||||||||||||||||||
| 1245 Sund | 1.68 | 2014 Loppa | -2.63 | ||||||||||||||||||||||||||||||||||||
| 0231 Skedsmo | 1.68 | 1818 Herøy | -2.51 | ||||||||||||||||||||||||||||||||||||
| 1 |
In some municipalities, and particularly the smaller ones, a large increase in population may be caused by asylum seekers
moving into the municipal reception centre. |
Comparing all municipalities, Modalen had the highest population growth by 5.8 per cent. Modalen is a small municipality, so in absolute figures the increase was only 20 persons. Ullensaker had the second largest population increase in 2003 by 3.7 per cent, and continues the development from 2002. Gamvik had the highest population decline of 5.9 per cent followed by Leka by 5.4 per cent.
When using relative figures for the population changes in the municipalities, the correct picture is not always given because small changes in municipalities with a small population often show a large effect, which often vary from one year to another. Most of the municipalities with a relatively large population growth are located close to a city centre, while those with the largest population decline are located in more rural areas. The changes in the population during 2003 reflect that the centralization during past years continues.
More divorced and fewer widowers
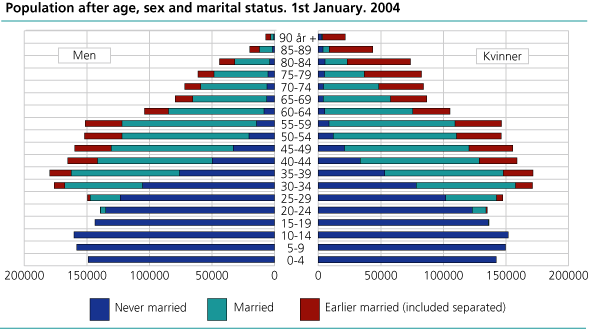
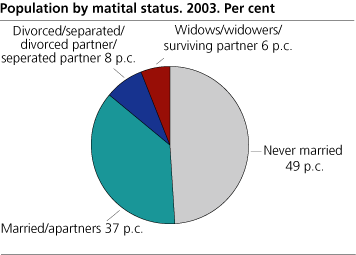
During past years there has been an increase in the number of divorced people in Norway, while the number of widowers slightly decreased. The figure for married/registered partners has also decreased. At the beginning of 2004, 49 per cent of the population had never been married, 37 per cent were married or living in a partnership, 8 per cent were divorced/separated or divorced/separated partners and 6 per cent were widowers/surviving partners. It is important to note that cohabitant partners are not taken into consideration, and these are grouped as "never married".
The statistics can also to be found in StatBank where the users can produce their own tables.
Tables:
- Table 1 Population by marital status, sex and age. 1 January 2004
- Table 2 Population by age and county. 1 January 2004. Absolute figures
- Table 3 Population by age and county. 1 January 2004. Per cent
- Table 4 Population by sex, age and marital status. 1 January 2004
- Table 5 Østfold
- Table 6 Akershus
- Table 7 Oslo
- Table 8 Hedmark
- Table 9 Oppland
- Table 10 Buskerud
- Table 11 Vestfold
- Table 12 Telemark
- Table 13 Aust-Agder
- Table 14 Vest-Agder
- Table 15 Rogaland
- Table 16 Hordaland
- Table 17 Sogn og Fjordane
- Table 18 Møre og Romsdal
- Table 19 Sør-Trøndelag
- Table 20 Nord-Trøndelag
- Table 21 Nordland
- Table 22 Troms
- Table 23 Finnmark
- Table 24 Population, by age and municipality. 1 January 2004. Per cent
- Table 25 Mean population by marital status, sex and age. 2003
- Table 26 Population by sex and age. Oslo. Urban district. 1 January 2004 (New 10 May 2004)
- Table 27 Population, by age. Per cent. Oslo. Urban district. 1 January 2004 (New 10 May 2004)
- Table 28 Population by sex and age. Stavanger. Urban district. 1 January 2004 (New 10 May 2004
- Table 29 Population, by age. Per cent. Stavanger. Urban district. 1 January 2004 (New 10 May 2004)
- Table 30 Population by sex and age. Bergen. Urban district. 1 January 2004 (New 10 May 2004)
- Table 31 Population, by age. Per cent. Bergen. Urban district. 1 January 2004 (New 10 May 2004)
- Table 32 Population by sex and age. Trondheim. Urban district. 1 January 2004 (New 10 May 2004)
- Table 33 Population, by age. Per cent. Trondheim. Urban district. 1 January 2004 (New 10 May 2004)
Contact
-
Magnus Haug
E-mail: magnus.haug@ssb.no
tel.: (+47) 40 81 14 91
-
Karstein Sørlien
E-mail: karstein.sorlien@ssb.no
tel.: (+47) 47 70 16 35
-
Linn Krokedal
E-mail: linn.krokedal@ssb.no
tel.: (+47) 95 47 97 47
-
Anders Sønstebø
E-mail: anders.sonstebo@ssb.no
tel.: (+47) 46 66 37 74
-
Espen Andersen
E-mail: espen.andersen@ssb.no
tel.: (+47) 92 61 00 46
-
Statistics Norway's Information Centre
E-mail: informasjon@ssb.no
tel.: (+47) 21 09 46 42
-
Oppdrag befolkningsstatistikk
E-mail: befolkning@ssb.no


