Content
Published:
This is an archived release.
Immigration main reason for male surplus
While Norway’s population on 1 January 2011 had a male surplus for the first time, amounting to 1 400, 11 900 more men than women lived in Norway at the beginning of 2012. There are various reasons for this increasing male surplus, but male labour immigration, particularly since 2006, is the main one.
The change from a surplus of 36 200 women at the beginning of 2006 to a surplus of 11 900 men this year; a change of 48 100 in just six years, is a result of different demographic conditions.
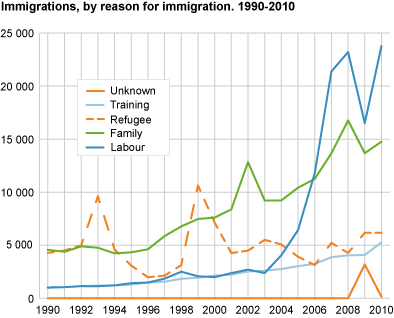
Immigration is the main reason. While during the six years 2000-2005 1 700 fewer men than women moved to Norway, during the next six years, 2006-2011, 43 700 more men than women immigrated. In both of these periods more men than women moved from Norway; 4 800 and 14 400 respectively. However, this emigration reduced the large impact of gender difference in immigration by just 40 per cent.
The period 2000-2005 resulted in a total net immigration of men that was 6 500 less than that of women, but the period 2006-2011 gave a total net immigration of men that was 29 300 higher than that of women. The year 2006 clearly marked the turning point, as the large labour immigration, particularly of male Polish citizens, then sharply increased. During the six years from 1 January 2006, the population grew by 48 100 more men than women, whereby the male immigration surplus of 29 300 constituted more than 60 per cent of this difference.
Contributory factors to current male surplus
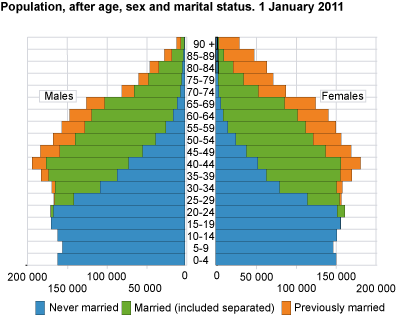
The fact that 4-6 per cent more boys than girls are born every year contributes to a reduction in the female surplus. Furthermore, we have, since 1997, the particular situation that more women than men have died, as there are now more women than men at the ages when most people die. This again is due to the sharply falling birth figures of the first 15 years after 1920, and that these women live about 6-7 years longer than men.
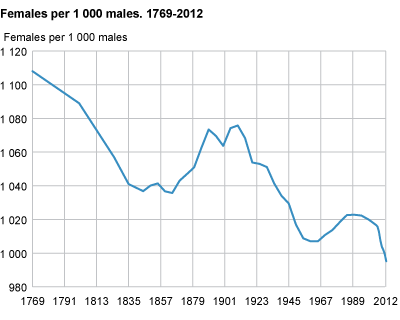
Varying historic female surplus
In a historic perspective, the female surplus has varied considerably; between 1 100 women per 1 000 men in 1769 and 1 007 in 1960, but women have always constituted the majority. After the mid-1960s, the relative figure increased to 1 022 around 1990, and then decreased again. Measured in persons, the surplus of women was highest in 1910, with more than 87 000, whereas in 1960 it was 12 000.
Changes between “the five large” citizenship groups
The number of foreign citizens grew by 38 000 during 2011, totalling 407 300, and accounted for 8.2 per cent of the total population at the turn of the year. This is the largest increase ever, and 1 300 more than in the previous record breaking year of 2008.
Once again, the number of Polish citizens increased the most, as has been the case every year since 2004. A total of 66 600 Polish citizens lived in Norway on 1 January; 11 500 more than one year before. Lithuanian citizens had the second largest increase, growing by 7 700 to 24 100. The number of Swedish citizens grew by 2 800, and the 42 000 Swedes constituted the second largest group of foreigners. With their large increase, the Lithuanians passed the Germans as the third largest group. The Danish held on to their fifth place of the largest groups. The 177 700 persons with these five citizenships constituted 44 per cent or almost half of all foreign citizens in Norway.
Smaller groups increased considerably in relative terms
The number of Eritrean citizens also increased considerably, by 1 900, but they were still just the fourteenth largest group, with 7 600 persons. The number of persons with citizenship from countries where seeking refuge is the main reason for living in Norway, such as Afghanistan, Iran, Iraq, Somalia and Ethiopia, decreased by 400.
There was a large increase in the share of citizens from South European countries such as Spain, Greece and Portugal, and also Hungary, with an increase of 27-36 per cent. In absolute figures, however, these groups are not yet large; totalling 7 900, after a combined increase of 1 800 in 2011. In per cent, the number of citizens from three African countries, Liberia, Burundi and Rwanda, decreased the most.
Immigration and emigration in particular, but also the transition to Norwegian citizenship, led to changes in the number of residents with foreign citizenship.
Big gender differences between the citizenship groups
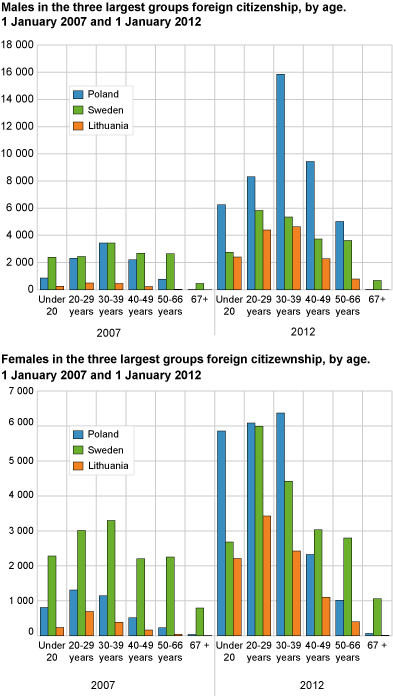
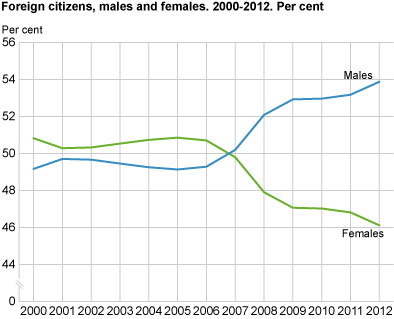
More than half of the foreign citizens in Norway; 54 per cent, were men. In 2006, the percentage was 49. This change is due to the previously mentioned large surplus of male, particularly Polish citizens aged 30-39 years, having since then immigrated to work in Norway.
For some of the citizenship groups, there are big differences between the number of men and women. Among Polish citizens, 67 per cent were men, and among the British 65 per cent. However, only 14 per cent of the Thai citizens were men, 18 per cent of the Filipino and 24 per cent of the Brazilian. Eighty per cent of the Polish citizens aged 40-49 years were men, and 71 per cent of those aged 30-39 years. In comparison, only 3 per cent of the Thai citizens in these age groups were men.
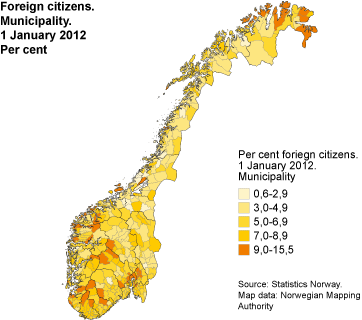
Seen in relation to the population, there were most foreign citizens in the municipalities Træna, Hemsedal, Hasvik, Båtsfjord, Hitra and Oslo, with between 16.5 and 14.2 per cent. There were fewest in Tjeldsund, Bindal, Beiarn and Rindal, where they represented under 1.5 per cent of population.
Residents on mapA total of 99.8 per cent of residents can now be placed on a map, which makes it possible to illustrate the population structure using grids. |
Tables:
- Table 1 Population, by age and county. Absolute figures. 1 January 2012
- Table 2 Population, by age and county. 1 January 2012. Per cent
- Table 3 Østfold
- Table 4 Akershus
- Table 5 Oslo
- Table 6 Hedmark
- Table 7 Oppland
- Table 8 Buskerud
- Table 9 Vestfold
- Table 10 Telemark
- Table 11 Aust-Agder
- Table 12 Vest-Agder
- Table 13 Rogaland
- Table 14 Hordaland
- Table 15 Sogn og Fjordane
- Table 16 Møre og Romsdal
- Table 17 Sør-Trøndelag
- Table 18 Nord-Trøndelag
- Table 19 Nordland
- Table 20 Troms Romsa
- Table 21 Finnmark Finnmárku
- Table 22 Population, by sex and age. Oslo. Urban district. 1 January 2012
- Table 23 Population, by age. Oslo. Urban district. 1 January 2012. Per cent
- Table 24 Population, by sex and age. Bergen. Urban district. 1 January 2012
- Table 25 Population, by age. Bergen. Urban district. 1 January 2012. Per cent
- Table 26 Population, by sex and age. Stavanger. Urban district. 1 January 2012
- Table 27 Population, by age. Stavanger. Urban district. 1 January 2012. Per cent
- Table 28 Population, by sex and age. Trondheim. Urban district. 1 January 2012
- Table 29 Population, by age. Trondheim. Urban district. 1 January 2012. Per cent
- Table 30 Population, by marital status, sex and age. 1 January 2012
- Table 31 Foreign citizens. Number and as a percentage of population, by county. 1 January 1976-2012
- Table 32 Foreign citizens, by citizenship, sex and age. 1 January 2012
- Table 33 Foreign citizens, by citizenship per 1 January 1975-2012
- Table 34 Population by sex, age and marital status. 1 January 2012
Contact
-
Magnus Haug
E-mail: magnus.haug@ssb.no
tel.: (+47) 40 81 14 91
-
Karstein Sørlien
E-mail: karstein.sorlien@ssb.no
tel.: (+47) 47 70 16 35
-
Linn Krokedal
E-mail: linn.krokedal@ssb.no
tel.: (+47) 95 47 97 47
-
Anders Sønstebø
E-mail: anders.sonstebo@ssb.no
tel.: (+47) 46 66 37 74
-
Espen Andersen
E-mail: espen.andersen@ssb.no
tel.: (+47) 92 61 00 46
-
Statistics Norway's Information Centre
E-mail: informasjon@ssb.no
tel.: (+47) 21 09 46 42
-
Oppdrag befolkningsstatistikk
E-mail: befolkning@ssb.no