Content
Published:
This is an archived release.
Public administration make use of e-commerce
31 per cent of the enterprises in public administration that purchase goods and services, accomplish a quarter of the acquisitions electronically. Many enterprises have efficiency improvement of acquisitions as part of their ICT strategy.
Almost 5 of 6 enterprises that responded on the survey make their own acquisitions of goods and services. The different activities that are part of acquisitions, can be supported by electronic processes. The share of enterprises that carried out the different activities electronically, varied between 40 and 60 per cent. Among enterprises that make their own acquisitions, 31 per cent stated that more than a quarter were fully or partly carried through supported by electronic processes. Correspondingly, 28 per cent stated that less than one per cent was carried through fully or partly with support of electronic processes.
Many will buy more via Internet
About 48 per cent of the enterprises that responded on the survey stated that they are responsible to work out an ICT strategy. That means that this task not belong to a superior enterprise. Among enterprises with such responsibility, 54 per cent had an ICT strategy that were updated within the last two years. Strategy on ICT security was most common among the mapped areas, only 2 per cent did not have one. Efficiency of acquisitions by use of electronic procedures was part of the strategy among 48 per cent of the same enterprises. The government have an objective setting for 2007 that all enterprises shall include use of electronic acquisition processes in their strategies.
In this survey public administration are defined as enterprises within state- and social administration, state business management, lenders of the state, state enterprises (owned 100 per cent by the state) and the Bank of Norway. 601 enterprises are covered by this definition and all of them have received a questionnaire. 59 enterprises applied for exemption, and this were agreed since they are represented by a superior enterprise. The selection includes the 542 remaining enterprises. Among these 499 or 92.1 per cent answered. There are substantial differences among these enterprises when it comes to the possibility to make own decisions on ICT. A department or a state enterprise with own management and 500 employees, has other qualifications to answer the survey than a local unity that are part of a department. To delimit the survey to decision-making enterprises, there are included preliminary questions to each topic. Se About the statistics for more details. |
Tables:
- Table 1 Share of enterprises with an ICT strategy updated within the last two years, by number of persons employed. 2006. Per cent
- Table 2 Share of enterprises with different areas included in a updated ICT-strategy. 2006. Per cent
- Table 3 Share of enterprises with authority to introduce new ICT systems, by number of persons employed. 2006. Per cent
- Table 4 Share of enterprises that suppose to realize gains of new ICT-systems at the following areas. 2005 and 2006. Per cent
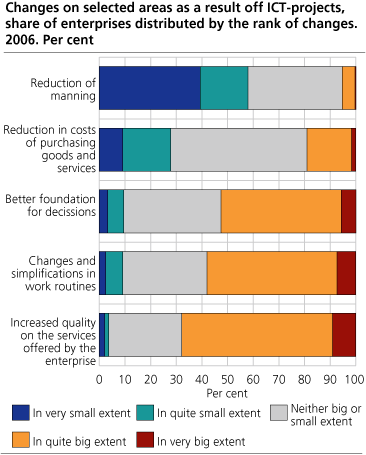
- Table 5 Changes on selected areas as a result off ICT-projects, share of enterprises distributed by the rank of changes. 2006. Per cent
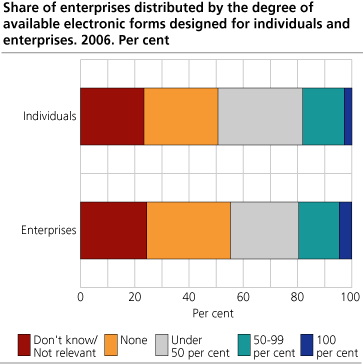
- Table 6 Share of enterprises in public administratrion that have forms designed for enterprises and/or individuals, by number of persons employed. 2006. Per cent
- Table 7 Share of enterprises distributed by the degree of available electronic forms designed for individuals and enterprises. 2006. Per cent
- Table 8 Share of enterprises distributed by the utilization of available electronic forms designed for enterprises and individuals. 2006. Per cent
- Table 9 Share of enterprises with authority to purchase goods and services, by number of persons employed. 2006. Per cent
- Table 10 Share of enterprises that carry through different activities electronic in connection whith purchasing goods and/or services. 2006. Per cent
- Table 11 Share of aggregated purchases that were carried through with aid of electronic transactions. 2006. Per cent (Corrected 20 September 2006)
- Table 12 Share of enterprises that have mandate to work out1, by number of persons employed. 2006. Per cent
- Table 13 Share of enterprises that handle personal data electronic, by number of persons employed. 2006. Per cent
- Table 14 Share of enterprises that handle confidential personal data according to law electronic, by number of persons employed. 2006. Per cent
- Table 15 Share of enterprises that are comprised by special laws about personal data and information security, by number of persons employed. 2006. Per cent
- Table 16 Share of enterprises that have worked out an strategy on ICT security, by number of persons employed. 2006. Per cent
Contact
-
Bruk av IKT i offentlig sektor
E-mail: iktstat@ssb.no