1. Entry page:
About the Statbank
Here you’ll find information about update times in the Statbank and links to various help pages.
Search in Statbank
The search includes
- Table titles
- Contents variables, i.e. what is counted or measured
- Variable headings (classifactions)
- Groupings under variables
- Value lists, for example numbers and names of municipalities or goods
The hit list is sorted by publication date. The most updated tables are placed at the top of the hit list.
The search does not include
- Topics
- Name and short name of the statistics
- Notes
We recommend combining searching with various filters on the page. The search uses Lucene search syntax via PxWebApi 2.
Search for multiple words
If you enter multiple words in the search field, you will get hits on tables that contain all of these words.
Search by phrase
If you want to search for two or more words that are found right after each other in the table, put quotation marks before and after the phrase. For example, "Northern Norway" or "general election".
Search at the beginning of words
You can use the character * after the search term to get hits on all words that start with those letters. For example, searching for hydro* will return hits on "hydropower companies".
Limit search to table title
If you want the search term to be found in the table title, use title:. For example title:Oslo
Using logical operators
You can use the logical operators AND, OR or NOT. With OR you get a match if one of the terms matches. With NOT you can filter out words you don't want to include. The AND operator is implied if you type several words in succession.
Some examples:
- labour OR labor
- (killed OR injured) NOT carnivores
Hyphens and other special characters
It is possible to search for the characters . (period) and _ (underscore). Example: Search for industry code 20.520.
However, as of today, you cannot search for the characters - (hyphen), + (plus), = (equals), / (slash) and ( ) (parentheses). Use quotation marks to search for names such as "Midt-Telemark". If you do not include quotation marks, you will get hits on tables that contain the words "Midt" and "Telemark".
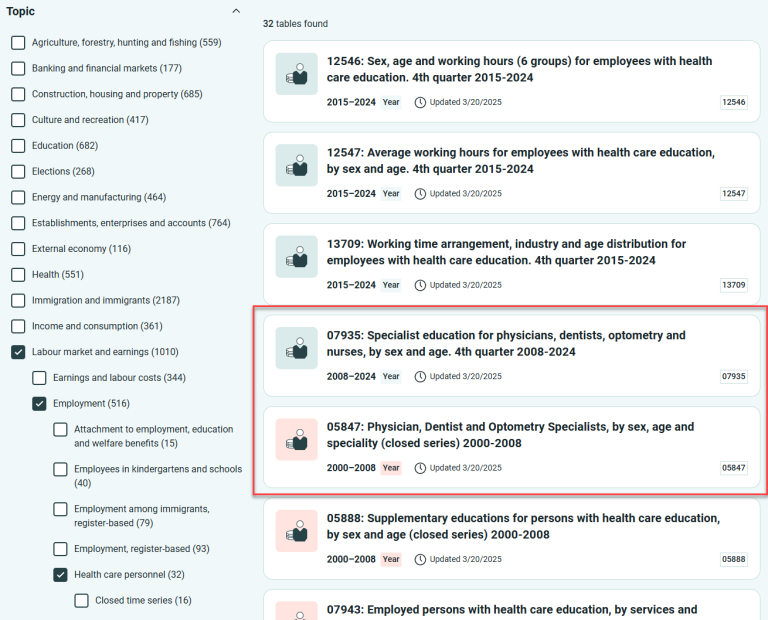
Filtering
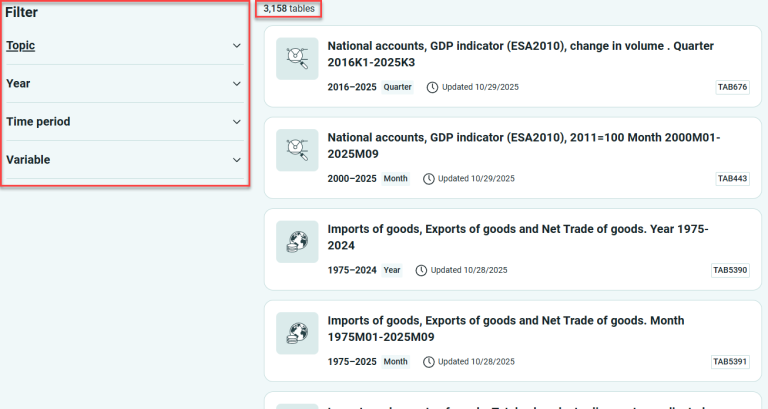
The entry page shows the most recently updated tables, with filters on the left. Above the table list, you’ll see how many tables match your criteria. Up to 15 tables are shown on the first page. If there are more matches, a “Show more” button appears at the bottom of the list.
Filters include:
- Topic (main and subtopics)
- Year (from–to)
- Time period (year, quarter, month, week)
- Variable (e.g., region, age, industry)
- Status (whether tables will be updated or not)
Each filter offers multiple options. Depending on your selections, the table list will change. You’ll always see how many tables match each filter option.
Tips for using filters:
It’s often useful to filter by Status first to narrow down the number of tables:
- Open Status filter with “Updated” selected. You can also choose “No longer updated.”
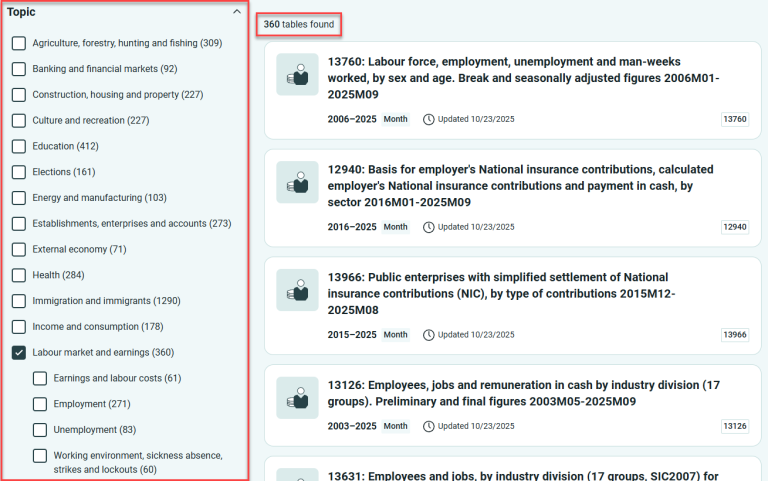
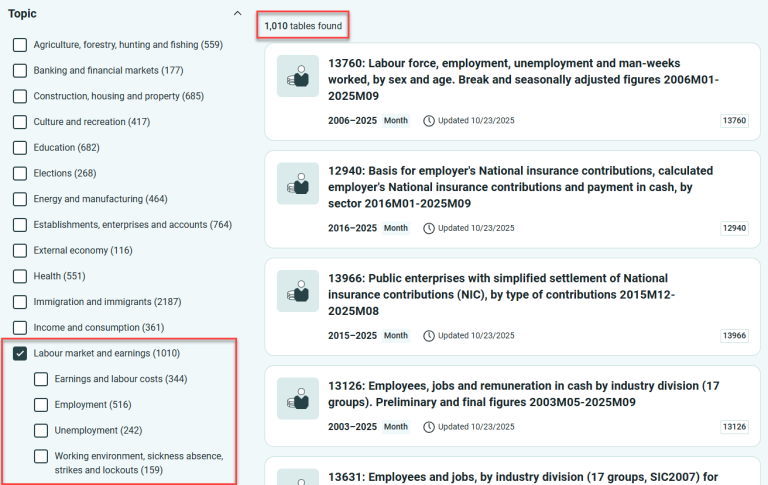
- If you select the main topic “Labour and wages,” you’ll see that 360 tables are updated. You can then choose a subtopic – in this case, there are four.
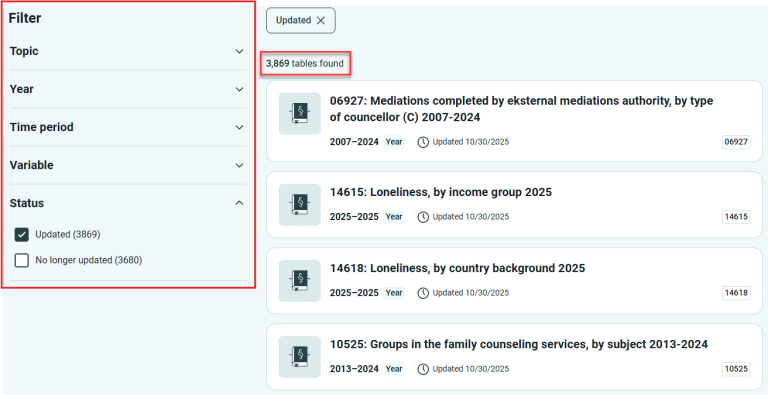
If you don’t select anything under Status, you’ll get many more tables.
Tables that are updated are shown in green, while those that are not are shown in red.
Selecting multiple main topics can quickly become overwhelming. If you want to switch from one main topic to another, remember to deselect the previous one.
The Variable filter includes classification variables, but not contents variables (i.e., what is measured or counted). Selecting multiple variables will return tables that include all selected variables. This helps narrow down the results quickly. The list is sorted by number of matches, and variables with no matches will disappear as you make new filter selections.
Above the result list, you’ll see the filters and search terms you’ve used. You can easily remove one or more selections to adjust your search. These filter choices are also reflected in the URL.
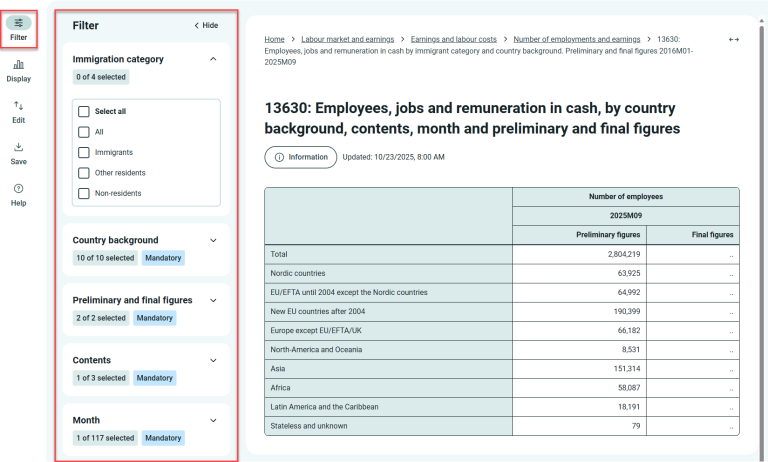
2. Table page:
Initial view of the table page
The table page is divided into three sections. On the far left, there are five buttons:
- Filter
- Display
- Edit
- Save
- Help
The table you see is generated by an algorithm and will change immediately when you select something under Filter. Filter is the default and appears open.
Example:
Several selections have been made – three under Immigration category and one extra month. The table has changed accordingly.
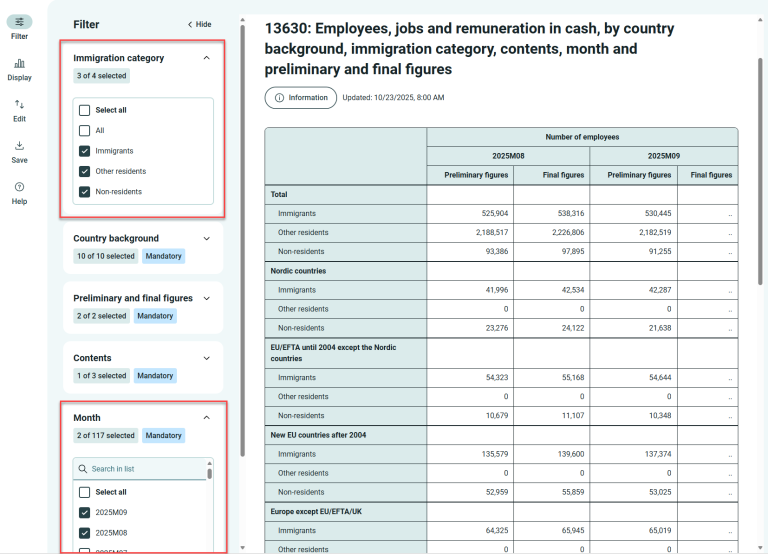
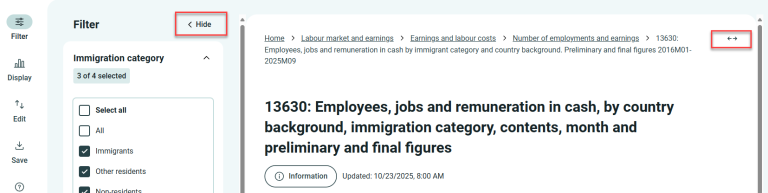
The more selections you make, the wider the table becomes. To view more of the table at once, click “Hide” and the arrows in the top right corner of the window.
Some variables have multiple levels. Under Country background, you can choose between “8 world regions” and “Selected countries.”
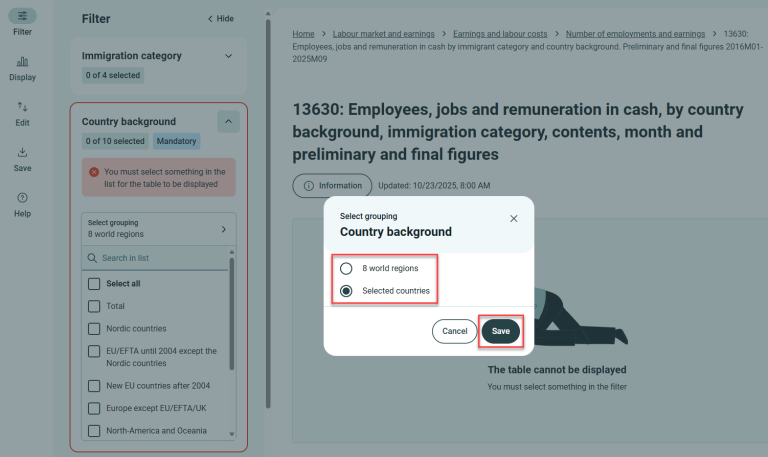
When switching to a new classification, the first value is often selected by default. Deselect it if you prefer others. In long value lists, there’s a search function. Search for and select the countries you want. Click the “X” in the search field to return to the list of selected countries.
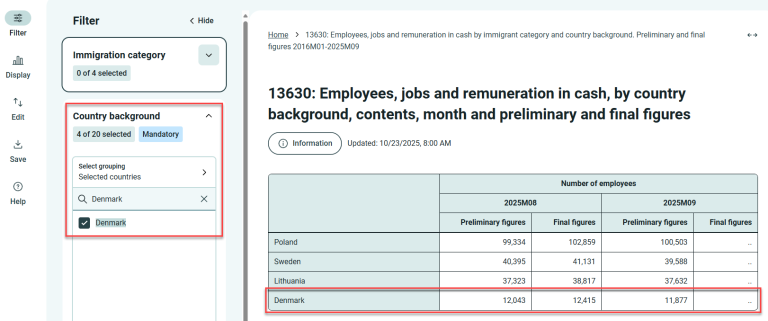
Example:
Search for Denmark under Selected countries.
Now 6 countries are selected.
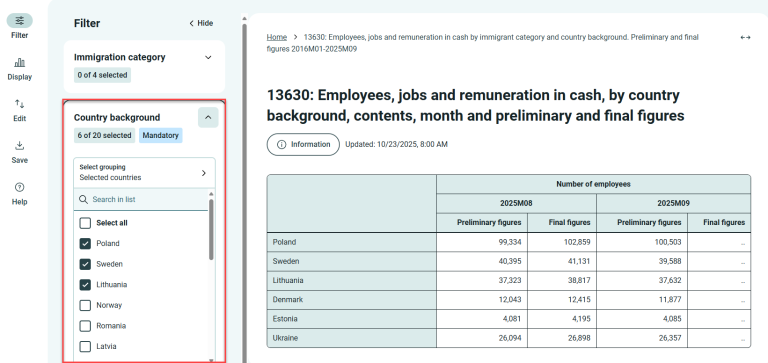
Search in long lists
- If the selection box (variable) contains many values, you will find a search field labeled “Search in list” at the top of the box.
- If “Select all” is checked and you don’t need all the values, click “Select all” and you will see that the selections are cleared.
- Search for what you want and check the items you want to include in the table.
- Repeat the search until you have selected all the values you need.
- When you search for a word, only the matching results will be displayed. Remove the search term if you want to search the entire list again.
- A new search does not automatically remove previously selected values.
- If you want to start over, click “Select all” twice, and all selections will be cleared.
- The search field applies to the list of possible choices, not the table itself. If you want to search within the table, you can use Ctrl+F.
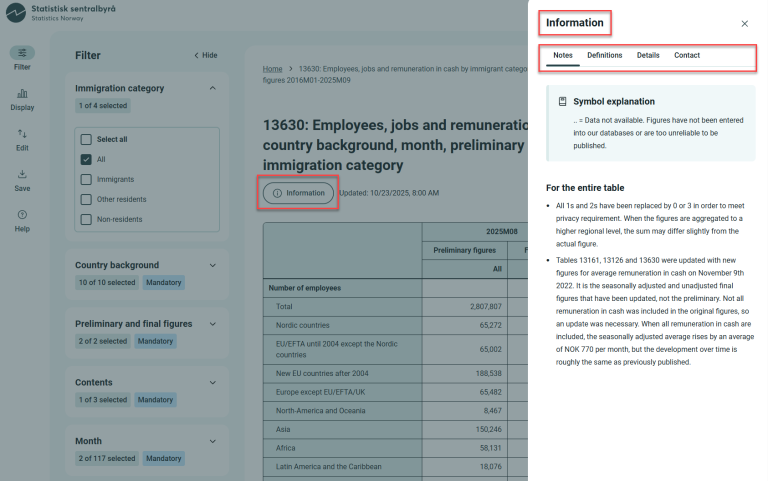
Information
The “Information” button provides:
- Notes (before footnotes) and symbol explanations
- Definitions (links to variable definitions, classification standards, and About the statistics will be added)
- Table details (e.g., update date, unit of measurement, reference time)
- Contact persons for the table
Display
Graph display is under development.
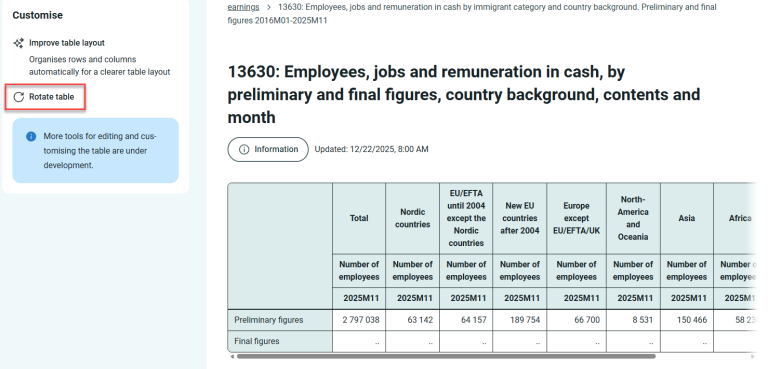
Edit
“Rotate table”: Sometimes the table becomes easier to read if you switch rows and columns (not in this example). You can rotate the table multiple times until you’re satisfied.
A new button, ‘Improve table layout’, is now available under ‘Edit’. You can use this if you have made new selections in the table and want to rotate it for better readability.
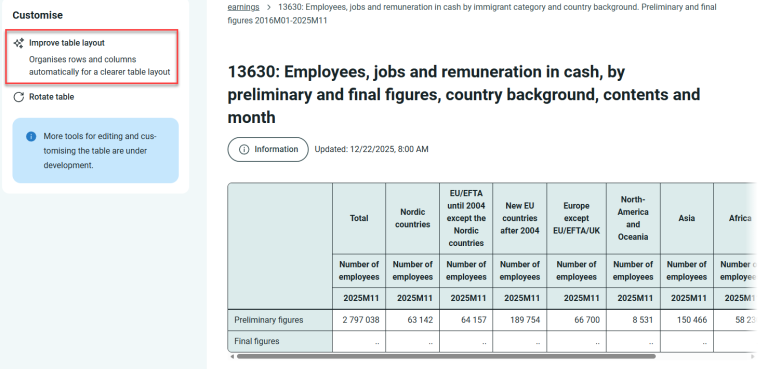
More tools for editing and customising the table are under development.
Save
You can save the finished table as a file. Available formats:
- Excel (.xlsx)
- Semicolon-separated with header (.csv)
- PC-Axis (.px)
- JSON-stat2 (.json)
- HTML (.html)
- Parquet (.parquet)
If the extract contains more than 200,000 cells, saving as Excel may be problematic. Choose another format in that case.
If cells show dates instead of numbers when opening a CSV file in Excel, the file itself is fine. This is due to Excel’s automatic date conversion. We recommend saving as Excel if you want to use Excel. Otherwise, in Excel, use “Data” → “From text/CSV” instead of double-clicking the file.
Link to Updated Table
You’ll get a unique link to your table, which we keep updated for you. You choose how new time periods are added:
- Don’t add new (table will only show your current selections)
- Add new (new periods will be added to your current selections)
- Add new, but keep same number (new period added, oldest removed)
After making your selections, you’ll get a unique link based on your choices. If you make changes, a new link is created.
“Saved query” is not intended for automation. For that, use the API. If you make too many requests in a short time, you’ll get a warning (429 error). Users who request many saved queries at 08:00 may have their IP address blocked.
API Query
API query functionality is under development.
3. Frequently asked questions
Where can I find regional figures?
Tables containing municipal figures are marked with (M) at the end of the table title. You can search for municipal tables in the search field at the top of the home page. Most municipal tables also contain county figures.
Tables marked with (C) are pure county tables, tables marked with (BU) have figures for basic statistical units and tables marked with (UD) have figures for urban districts.
You can also find tables with divisions by electoral district or police district. Documentation of different regional divisions can be found in Statistical Classifications and Codelists (Klass).
Combine with the subject filter and the other filters to find the right table.
We are working on creating a separate filter for regional divisions.
Why do you have so many tables that are almost identical?
The best would be if we could gather all the numbers related to the same thing in one table. But if we combine all variables (sex, age, municipality, education level, etc.) for, for example, disability pension recipients, the figures could be used to identify individuals. Therefore, we divide the figures into several tables, each combining only a few selected variables.
Why do table titles look the way they do?
The table title is the heading you see in a hit list or a link that leads you to a specific table. The table title describes what is being counted or measured in the table, and the categories or classifications in which the numbers are divided (sex, age, industry, region, etc.). The table title may also display the table ID (number) and the period covered. Additionally, it may include the unit of measurement, base year for indices, and information about adjusted/unadjusted and preliminary figures if this applies to the whole table.
The table page shows an automatically generated table title for the table. It lists the classification variables that have been selected. If you rotate the table or choose other classification variables, the generated table title will change accordingly. Therefore, it is often composed a little differently from the full table title you will find on the homepage and in the breadcrumb trail on top of the table page.
When are the tables updated?
Every morning at 08:00, Statbank Norway is updated with new figures. Corrections to figures may occur at 11:30.
Please find overview at Upcoming releases and publications and information about next update on the page for each individual statistics. Unfortunately, we do not have a corresponding overview at the table level.
You can get an overview of published tables via RSS feed, see https://www.ssb.no/en/diverse/rss.
Why are tables in the Statistics Bank sometimes empty or unavailable?
Metadata are updated at 05:00 and 11:30, and during these updates, the tables cannot be opened. Between 05:00 and 08:00, some existing figures may appear as “.” or “0” while they are being adjusted.
Why are some tables discontinued?
There can be various reasons why a table is no longer updated. In some cases, it is because we no longer collect or have access to such figures. It may also be due to new legal, professional, or social conditions that require the figures to be compiled in a new way. In such cases, we usually create new tables to replace the discontinued ones. Changes are logged in Changes to tables in Statbank Norway.
Why do some cells show a date instead of figures when I open a csv file in Excel?
Excel is sometimes 'too clever' and interprets numbers as dates. To fix this, you need to change the cell format from Date to Number or Text. Or you can open the CSV file in another editing program.
What does the selection box "contents" mean?
The contents variable shows what is counted, measured, or calculated. This could be, for example, employed persons, enterprises, income, or area. This will be the first selection box in each table. The table always contains at least one contents variable. The contents variable will always have a unit of measurement, for example, number, percent, NOK, or square meters.
What does "preliminary figures" mean?
Some statistics are first published with preliminary figures, which may be uncertain. After a certain period of time (which can vary from one statistics to another), the preliminary figures are replaced with final figures. More information about this can be found under "About the statistics", the section "Accuracy and reliability", on the statistics' website.
What do "seasonal adjustment" and "trend" mean?
Seasonal adjustment is used to remove what we call seasonal variations, such as holiday periods or Christmas shopping, from monthly or quarterly statistical time series. Statistics that use seasonal adjustment explain this further on their website, under "About the statistics", "Production", section "Seasonal adjustment."
The trend shows the long-term tendency in the data. If the collected data have large random variations, the trend is more suitable as information than the seasonally adjusted figures.