Content
About the statistics
Definitions
-
Name and topic
-
Name: National accounts
Topic: National accounts and business cycles
-
Next release
-
-
Responsible division
-
Division for National Accounts
-
Definitions of the main concepts and variables
-
See Concepts and definitions in national accounts for explanations.
Valuation
Registration of values: A transaction may be registered at different values, depending on under which circumstances it is registered. Different concepts regarding valuation are also relevant for the general aspect of registration (cf. cash values or accruals values, and other principles for the recording of statistical data). The transactions of variables in the national accounts follow the accrual principle. Thus, taxes and subsidies on production should be registered as accrued values and not as cash values as recorded in the government accounts.
In the description of the transaction of goods and services several price concepts are used. Output is valued at basic prices. Basic price is the price the seller receives, after corresponding taxes on the product are deducted (and subsidies added). The use categories, both intermediate consumption and final use, are valued at purchaser prices, that is the price the purchaser must pay. Exports are valued at fob (free on board), while imports are valued at cif (cost-insurance-freight).
The value added of an industry is "valued" at basic prices (calculated as output at basic prices less intermediate consumption at purchaser prices). The total value added of all the industries is also "valued" at basic prices.
GDP is "valued" at market prices, which means that taxes on products, including VAT, less subsidies on products are added to the total value added of the industries at basic prices.
-
Standard classifications
-
The accounting system of the Norwegian national accounts is based on the international standards for national accounts, i.e. 2008 SNA and ESA 2010. The accounting system outlines the framework and contents for production of national accounts statistics. The level of detail in the classifications used for compilation of quarterly and preliminary annual national accounts are more aggregated than in that used for calculation of the annual national accounts.
In addition to accounting structure, the international standards give recommendations of groupings or classifications to be used in the national accounts:
Activity classification
The classification of Industries in the National Accounts follows the Norwegian Standard Industrial Classification (SN2007), which is based on NACE Rev.2. Several levels of aggregation have been introduced for publication and reporting purposes.
Classification of non-financial assets and gross fixed capital formation
Non-financial assets are classified by type of aggregates defined in 2008 SNA, such as fixed assets, inventories, valuables, and non-produced assets, including both tangible assets such as land, subsoil-assets, water resources etc., and intangible assets such as transferable contracts etc. Gross fixed capital formation is grouped by main type within building and construction, machinery and equipment and transportation equipment.
Product classification
The product classification used in the national accounts is based on the EU's standard product classification CPA - Statistical Classification of Products by Activity in the European Community. The CPA groups products by activities, i.e. it defines characteristic products within each activity and connects them to the activity classification NACE Rev.2. The annual accounts supply and use tables contain about 700 products, in addition to which some products are also incorporated purely for technical reasons. The system to elaborate preliminary annual and quarterly accounts contains about 90 products. The separation on products might to large extent be considered as a tool to balance the national account system and to undertake calculations in constants prices.
Classification of individual consumption by purpose
The classification of Consumption expenditure groups in the National Accounts is based on the international classification COICOP - Classification of Individual Consumption by Purpose, published by the UN.
Classification of the functions of government
The classification of the functions of government by purpose applies to all types of general government expenses, such as government final consumption expenditure, gross fixed capital formation, subsidies, property rents (i.e. expenses), capital transfers and other transfers for use in government financial accounts and in the national accounts. This classification is based on the international classification COFOG - Classification of the Functions of Government, published by the UN.
Classification of the purpose of non-profit institutions serving households (NPISH)
This is a minor purpose classification which applies to expenses of NPISHs. It is based on the international classification COPNI - Classification of the Purposes of the Non-Profit Institutions Serving Households, published by the UN.
Administrative information
-
Regional level
-
National level.
-
Frequency and timeliness
-
The monthly national accounts (MNA) are published about 40 days after the end of the given month.
The quarterly national accounts (QNA) are published about 40 days after the end of the given quarter. Quarterly figures are calculated as the sum of three months (from monthly national accounts).
The first estimates of the preliminary year is published about 40 days after the end of the year.
-
International reporting
-
Published figures are reported to Eurostat, the International Monetary Fund (IMF) and the Organisation for Economic Co-operation and Development (OECD).
-
Microdata
-
Not relevant
Background
-
Background and purpose
-
The national accounts (NA) statistics are designed to provide a consistent and comprehensive survey of the overall national economy. The national accounts give both a summarised description of the economy as a whole and a detailed description of transactions between different parts of the Norwegian economy, and between Norway and the rest of the world. The national accounts also provide information on capital stocks and employment.
The first Norwegian national accounts based on modern principles were published by Statistics Norway in 1952. Annual series national accounts were calculated back to 1865 during the 1950th.
Final annual national accounts figures are based on all available final economic statistics and therefore take time to produce. The purpose of the quarterly national accounts is to provide updated information about short-term developments in the Norwegian economy based on an overall, consistent accounting system. Statistics Norway has produced and released quarterly national accounts (QNA) on a regular basis from 1953 but were not published at fixed intervals from the 1970s to the beginning of the 1980s. A new model for a QNA system was developed at the beginning of the 1980s and has been used since 1985, with some modifications.
National accounts are used as a tool to compare the economic situation in different countries, and therefore it is important that the national accounts in various countries are based on a common template. Staff involved in elaborating national accounts in Statistics Norway participated actively in developing international recommendations and concepts regarding national accounts. The first international standard for national accounts, 1953 System of National Accounts (1953 SNA), was published by UN in 1953.
From time to time adaptations or changes are made to the common international recommendations for national accounts. This requires corresponding changes in the construction of the Norwegian national accounts. At different time intervals, new source statistics are produced and indicate that parts of the national accounts figures need to be revised. Since one objective of the national accounts is to provide a picture of the development over time which is as correct as possible, it is not possible to introduce such changes from one year to another. With different time intervals, it will therefore be necessary to carry out major revisions of the national accounts figures, so-called main revisions, in order to introduce adaptations due to new international recommendations or introduce new levels based on new statistical sources. As part of these main revisions the time series are also revised so that the revised national accounts can give a consistent picture of the economic development over time.
In recent decades, Statistics Norway has carried out main revisions published in 1995, 2002, 2006, 2011 and 2014. The main purpose of main revision published in November 2014, was to incorporate updated international recommendations in 2008 SNA and ESA 2010. Changes due to this main revision are described, among else, in the article Main revision 2014. Planned changes in the national accounts statistics. See About the statistics for the annual national accounts for more information about main revisions. The publication History of national accounts in Norway. From free research to statistics regulated by law also provides more information about the history of national accounts in Norway, including main revisions. In the future main revisions of the national accounts normally will be carried out every five years.
Since the QNA are completely harmonised with the annual national accounts, it is also necessary to revise the QNA figures once the annual national accounts figures have been revised.
-
Users and applications
-
The quarterly figures are mostly used for observation and analysis of the current economic cycle. The QNA figures also serve as a basis for making forecasts of the future economic development, the government’s work with the national budget and other economic planning. In addition, the QNA contribute with material for research and development. Annual and quarterly national accounts are a useful tool for analyses of the economic development and structures in Norway. The national accounts are also used to compare the economy in different countries.
The annual and quarterly national accounts therefore have a wide group of users, from school pupils and students to public and private institutions that actively use the statistics in their analyses and investigation of economic structure and development. Active users include the Research Department in Statistics Norway, the Ministry of Finance, Norges Bank, international organisations such as the IMF, the OECD, the World Bank, the UN and Eurostat, resident and non-resident financial sector analysts, and the media.
-
Equal treatment of users
-
No external users have access to the statistics and analyses before they are published and accessible simultaneously for all users on ssb.no at 08.00 am. Prior to this, a minimum of three months' advance notice is given in the Statistics Release Calendar. This is one of Statistics Norway’s key principles for ensuring that all users are treated equally.
-
Coherence with other statistics
-
The monthly figures are the basis for quarterly figures, quarterly figures are calculated as the sum of three months. Quarterly figures will be updated when publishing the third month in the quarter. This means that there may be deviations between the monthly and quarterly figures in the two months before the new quarter is calculated. The deviations will mainly apply to seasonally adjusted figures. In addition, the monthly publication includes a table showing rolling numbers for three and three months. The three-month growth is calculated by comparing a three-month period with the previous three-month period. For example, the volume change in the rolling table for July is given by comparing the period May-July with February-April. Figures for March, June, September and December will correspond to growth for a quarter.
All historical figures are consistent with both preliminary and final annual national accounts figures in fixed and current pricesThe Norwegian Balance of Payments (BOP) is an integrated part of the Norwegian system of national accounts, and the BOP figures are fully consistent with other preliminary and final quarterly and annual national accounts figures. Furthermore, quarterly and annual national accounts figures are fully consistent and compatible with the institutional sector accounts. The regional national accounts, and various satellite accounts (environment, tourism, health,non-profit institutions) are consistent with the above mentioned national accounts statistics. Previous published figures from the regional accounts and various satellite accounts are, however, not revised as a part of main revision of the national accounts, so figures for previous years may not necessarily be compatible with updated NA time series.
As mentioned in the chapter "Production: Data sources and sampling", the national accounts are based on various statistical sources. The source statistics may not use the same definitions or groupings as used in the national accounts. As a result, figures in the source statistics may be adapted or corrected before being used in the national accounts. Published figures in the source statistics of certain industries may therefore not correspond to published figures in the national accounts.
-
Legal authority
-
Not relevant
-
EEA reference
-
- Regulation (EU) No 549/2013 (ESA 2010).
- The European Parliament and of the council of 21 May 2013 on the European system of national and regional accounts in the European Union (text with EEA relevance).
Production
-
Population
-
The coverage of the national accounts is defined by international guidelines in the 2008 System of National Accounts (2008 SNA), published by the UN, the OECD, the IMF, the World Bank, and the Commission of the European Communities, and the European System of National and Regional Accounts (ESA 2010).
The total national economy, and the distinction between the national economy and foreign countries, is defined in terms of resident units. A unit is defined as a resident unit of the country when it has a centre of economic interest in the economic territory of the country - i.e. when it is involved in economic activities on this territory for an extended period of time (one year or more).
Two basic types of information are recorded in the national accounts: flows and stocks. Flows refer to actions and effects of events that take place within a given period of time, for example the output of an industry in one year. Stocks refer to positions at a certain point of time, for example the value of capital stock or the number of employed persons.
The national accounts consist of two main sets of tables; supply and use tables (SUT), also described as the real accounts, and the institutional sector accounts. The real accounts are based on local kind-of-activity units (KAUs), while the institutional sector accounts are based on institutional units. Institutional units are economic entities that are capable of owning goods and assets, of incurring liabilities and of engaging in economic activities and transactions with other units in their own right. An institutional unit contains one or more local kind-of-activity units (local KAUs). The local KAUs are classified by type of activity. An activity is characterised by an input of products, a production process and an output of products. All local KAUs engaged in the same or similar kind-of-activity constitute an industry.
The SUT at current and constant prices gives a structured overview of the supply (output and import) and use (final consumption, gross fixed capital formation, changes in inventories, export and intermediate consumption) of products (goods and services) in the economy. For each industry the value added is calculated as the difference between output and intermediate consumption. The value added in an industry can also be decomposed into compensation of employees, consumption of fixed capital, other taxes on production (net of subsidies) and operating surplus. The real accounts also give information on fixed assets, as well as wages, hours worked, full-time equivalent persons and employed persons by industry. Monthly national accounts does not include figures for employment etc..
Furthermore, the real accounts provide the basis for the calculation of the Gross Domestic Product (GDP) and other central macroeconomic measures. The annual growth in volume and price are calculated for most variables.
The non-financial sector accounts are based on institutional units. Institutional units are capable of providing a full set of accounts. The non-financial sector accounts describe all economic transactions in the various sectors. The accounts also provide information on the stocks financial and non-financial capital. Financial sector accounts are also based on institutional units. The institutional units are grouped in institutional sectors on the basis of their principal economic functions, behavior and objectives. The non-financial sector accounts are consistent with the real accounts. The further description of the national accounts covers the part of the national accounts that is based on the annual SUT (the real accounts).
The coverage of the preliminary annual and quarterly real accounts is the same as the final annual SUT
The accounting structure in the system that produces monthly, quarterly and preliminary annual figures (MNA) is, however, more aggregated than in the system that produces the final annual SUT. While the SUT in the annual accounts consists of about 130 industry groups and 700 product groups, the SUT in the MNA consists of about 80 industry groups and 120 product groups. The MNA and QNA system produces tables with seasonal adjusted figures for industries' value added, household consumption for aggregated consumption groups and for central macroeconomic measures. However, only tables for final expenditure and gross domestic product are published on a monthly basis, while the QNA contain more details.
-
Data sources and sampling
-
The calculations of the annual real accounts are based on statistics from several different sources, such as the structural business statistics for manufacturing and other industries, accounting statistics for general government and enterprises, statistics for wages and earnings, external trade statistics, household consumer surveys and employment statistics. Some parts of the national accounts are compiled more or less directly from the source statistics, while other parts are based on calculations and estimates.
Monthly information is used for compiling monthly national accounts, such as the production index of industrial production, the index for retail sales, consumer price index, building statistics, producer price indices and much more. For some service industries where we lack explicit production indicators, monthly information about jobs, working days and absence is obtained from the A-ordning. For investments where we only have quarterly information, such as oil investments, quarterly figures are conventionally distributed by month. In the months before we get the so-called oil census, the development is used in the planned investment figures reported together with those performed for a quarter. In connection with the work on the QNA, quarterly information is incorporated and an update of the previous months is made. Quarterly national accounts will appear as the sum of the three months in the quarter.
The source statistics used to calculate national accounts are with a few exceptions produced by Statistics Norway.
Having the reporting responsibility to Eurostat, the Division for National Accounts occasionally documents the calculations for the final annual national accounts, see Norwegian National Accounts - GNI Inventory for ESA95.
In addition, there are a number of reports giving more detailed documentation of calculation of figures for various specific industry groups or other parts of the national accounts (mostly in Norwegian only).
The documentation report for the Quarterly national accounts gives an overview of central sources and methods used for quarterly accounts compilation. This will be updated in the autumn of 2018 to include monthly national accounts.
-
Collection of data, editing and estimations
-
Compilation of the final annual real accounts
The annual national accounts are mainly based on statistics collected by other divisions in Statistics Norway. To some extent data produced by external suppliers are also used.
The process of compiling the final annual national accounts starts with the calculation of independent supply and use estimates for all goods and services at current prices. To some extent, source data are extracted directly from the databases and converted into national accounts codes and format. Other parts of the economy are based on more complex calculations, by means of different statistical sources and/or assessments.
The source data are critically evaluated and compared with alternative sources (for some parts of the economy). In some areas, the statistics have to be adjusted in order to satisfy the requirements of the national accounts. In areas where the statistics are incomplete, evaluations are essential. In the process of estimating national accounts data, estimated national accounts figures are critically evaluated and controlled in several steps.
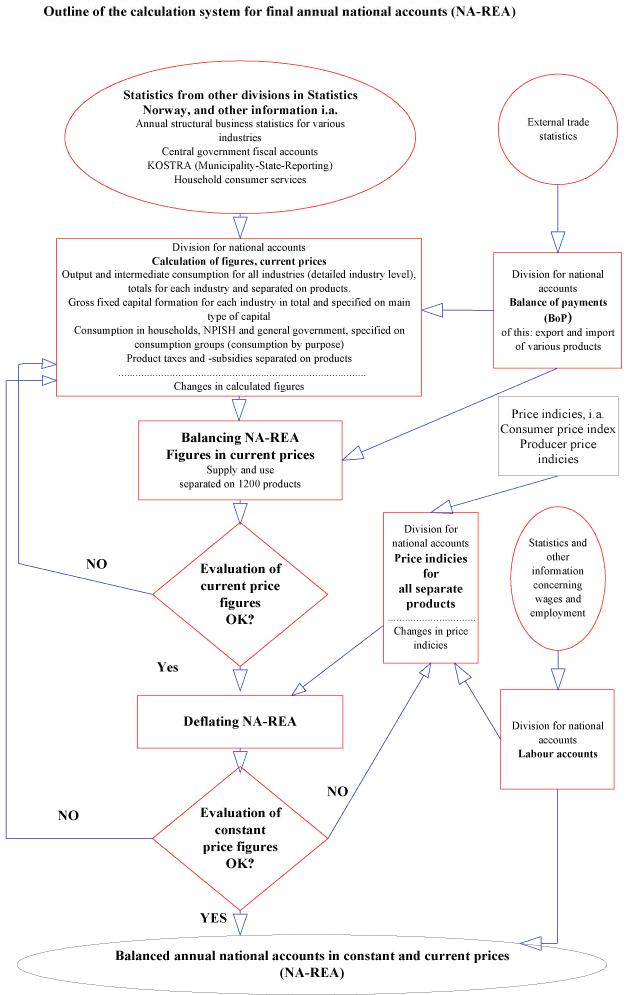
Finally, supply and use for each of these goods and services are balanced using supplementary information and quality assessments of the various statistical sources. This results in integrated supply and use tables at current prices.
The figure below gives an outline of the calculation system for final annual national accounts figures. First, detailed figures are calculated and balanced in current prices. Then the system calculates figures in constant prices, based on the detailed current price figures and corresponding price indices. The deflation (current values being divided by price indices) takes place at the most detailed product level: A price index is allocated to each detailed product. The individual products are as price homogeneous as possible. Constant price figures in the annual national accounts are calculated using the price level of the previous year, which means that the base year is changed every
year.The deflation approach has in fact two dimensions, (i) differentiated by main categories of supply and use (deflating output, imports, exports and implicitly for domestic use), and (ii) differentiated through valuation (deflating current values at basic prices by price indices and implicitly determining the other value components, including adjustments against values at purchaser prices). The method used to calculate constant figures is called double deflation, i.e. a separate deflation of output and intermediate consumption is carried out in order to arrive at value added at constant prices as a balancing item, based on a detailed input-output framework (supply and use tables).
Figure 1. The calculation system for final annual NA figures (Click)
For a more detailed documentation, see Norwegian National Accounts - GNI Inventory for ESA95.
Compilation of the MNA and QNA
The majority of the short-term statistics produced by Statistics Norway are transferred to the MNA system by use of a direct link to the relevant databases. The information in the data sources about growth is used more or less directly in the MNA system. Some other input data series in the MNA system, however, are based more or less on calculations and estimations, using various types of information from Statistics Norway and other sources. Quarterly figures are calculated as the sum of three months
The national accounts data for a specific month, quarter or year are revised in accordance with an ordinary publication and revision cycle. The quarterly figures within a specific year t become final 21 months later after the end of the year t. In addition, periodical main revisions generate revised figures.
In the process of calculating MNA or QNA figures for a specific month or quarter, the short-term statistics source data are critically evaluated and compared with alternative sources (for some parts of the economy). In some cases, the information in the source statistics must be adjusted in order to satisfy the requirements of the quarterly national accounts. In the process to estimate MNA data estimated MNA figures are critically evaluated and controlled in many steps.
Monthly process
The figure below gives an overview of the Norwegian MNA and QNA estimation process. The figure shows that the MNA system is based on two main pillars: a) The SUT for the (final) annual national accounts and b) short-term statistics.
Figure 2. The computing system in the Norwegian MNA/QNA

The main principle in the MNA system is that the national accounts figures for the current quarter are computed based on the development of short-term indicators and the current-price figures from the base year. The base year (t-2) is the latest calculated final version of the annual national accounts. The method is the same for most common variables: The value in the base year is given the same growth rate (percentage change) as in the appropriate indicator, or a grouping of different relevant indicators.
A simple projection method, based on the development in previous periods, is used if an indicator does not cover the whole period from the base year to the current quarter.
The indicator compilations are made in the indicator process (box 2 in the figure).
However, the indicator process alone does not give a complete harmonised account at current and constant prices. To calculate values for variables that are not calculated in the indicator compilations, and to harmonise the accounts, we use an input-output model (box 3 in the figure).
The input-output model includes a commodity-flow balance, a price input-output system and a set of equations for summaries and definitions. It now comprises over 12 000 equations in total. The input-output coefficients are calculated from the SUT in the base year. The variables calculated in the indicator compilations are transferred to the input-output model as exogenous variables. To calculate balanced accounts at current prices we need price indices on all supply and use categories. These are computed in the model by weighting together product price indices with the input-output coefficients as weights. Each product gets three different price indices, one for resident output delivered to the home market (to resident users), a second for import and a third for export.
The price index for an industry’s total output is then calculated as a weighted average of the price indices for the home and export market using the input-output coefficients as weights. The price indices of intermediate consumption, final consumption expenditure and gross fixed capital formation are calculated in a similar way, using the import and home market price indices and the input-output coefficients.
The model also calculates variables which are not covered by short-term statistics or other information and therefore not calculated in the indicator process. These calculations are based on simple assumptions. For instance, intermediate consumption for most industries at constant prices (the total except FISIM) is assumed to be a fixed proportion of total output for the relevant industry. The distribution of intermediate consumption (except FISIM) on different products at constant prices is also assumed to be the same as in the base year. The industries’ use of FISIM as intermediate consumption is supposed to equal the growth in total output of FISIM services. Output in the retail and wholesale trade activities in constant prices is assumed to follow the development of the use of the various goods in constant prices, such as household consumption, intermediate consumption and gross fixed capital formation of the various specific goods (that means supposed fixed margins).
Changes in stock of separate products are (for most products) calculated as the difference between the total supply and use of the product. As in the annual NA, the changes in stock may be adjusted if that seems reasonable after an evaluation of the figures.
The results are stored in the time series database (box 4 in the figure), which, among other things, provides the basis for different sets of tables (box 6). At the moment there are two different sets of tables (with seasonal unadjusted figures), sets for internal checks and analyses of data and more aggregated sets of data for publishing.
Process 1-4 describes how the quarterly seasonally unadjusted figures are estimated. The unadjusted figures are seasonally adjusted (box 5) using a seasonal adjustment program.
The method adopted to compile the MNA is highly mechanical. This applies to the update of variables in the national accounts based on short-term statistics as well as the balancing of commodities, the computation of indirect taxes and factor incomes and the overall balancing of the GDP and main aggregates. Technically, the data systems are programmed in FAME and TROLL (the latter is used for the input-output model only).
Checks and/or the evaluation of data are, however, performed in several steps. The MNA system offers a unique opportunity to compare different types of input data. The evaluation of the different sources is done in close contact with the relevant statistics divisions in Statistics Norway. A more thorough evaluation is being done when processing and publishing quarterly figures, while the monthly process is more automated and less profound. Therefore, only final expenditure and gross domestic product are published on a monthly basis while the quarterly accounts offer more details.
Quarterly figures are calculated as the total of three months at quarterly releases. Quarterly figures will be updated only when publishing the third month in the quarter. This means that there may be a mismatch between the monthly and quarterly figures in the interim months. This applies mainly to seasonally adjusted numbers. That is, when you get a new observation (new month), it will normally affect the seasonally adjusted figures back in time. We do not update the QNA numbers that have also been sent to international organizations before the next quarters release. At the same time, we show figures for three-month growth. This is calculated by comparing a three-month period with the previous three-month period. For example, the volume change in July is given by comparing the period May-July with February-April. Figures for March, June, September and December will correspond to growth for a quarter. This means that users may get a continuous update of the quarterly figures by looking at the monthly publication.Annual process and alignment
The MNA system is updated with a new base year every year (i.e. the latest final version of the annual accounts). The database for the annual accounts (box 1a), as well as the base data and coefficients in the harmonisation model (box 3) are updated. At the same time, it is possible to implement new indicators, carry out changes in the input series and in the model, etc. Such changes are not carried out in an ordinary monthly or quarterly process.
The recalculation of the monthly accounts is carried out by distributing the annual figures between the months using the original monthly figures as keys. The recalculated monthly accounts will then add up to the annual accounts at constant and current prices.
The harmonisation is based on the principle that the differences between the monthly changes to the original and harmonised series shall be as small as possible. The monthly accounts should add up to the figures in the annual accounts.
When the base year is updated the MNA for that year is aligned automatically.
Reference year
All figures are published at current prices and (for most sizes) constant prices (i.e. the accounts also specify volume and price changes). Constant-price estimates in the national accounts are calculated based on the previous year's prices; i.e. the base year is changed every year. Subsequently, data on volume changes are constructed in terms of growth rates and corresponding implicit data on changes in prices. In parallel, time series of volume figures are constructed by using prices from a reference year. The constant-price estimates are consistent with the data on changes in volume in the series of growth rates. Since the chaining is carried out separately for all items, the table components do not, however, necessarily add up to the totals of the same table.
The publication Quarterly national accounts gives more information about sources, methods and the processes used to calculate quaterly NA figures. This will be updated in the autumn of 2018 to include monthly national accounts.
-
Seasonal adjustment
-
The methods and routines used to produce seasonally adjusted figures are described in the chapter About seasonal adjustment.
-
Confidentiality
-
§ 2-6 of the Statistics Act states that data under no circumstances shall be published in such a way that they may be traced back to the supplier. This means that the general rule is not to publish data if there are fewer than three enterprises in an industry. In practice, this means that for some detailed industry categories, figures must be aggregated up to a more aggregated industry group before they can be published.
-
Comparability over time and space
-
Consistent monthly time series will exist back to 2016. Consistent quarterly time series will exist back to 1978 and annual time series back to 1970. Annual NA figures for the years 1865-1970 are based on the previous standards used for the national accounts and are not compatible with the up to date figures after the latest main revision of the NA.
Quarterly figures are calculated as the sum of three months. Quarterly figures will be updated only when publishing the third month in the quarter. This means that there may be mismatch between the monthly and quarterly figures in the interim months, see the description of the monthly process above.
Monthly figures, and thus quarterly figures, are aligned with the final annual national accounts figures, both in fixed and current prices. The other parts of the national accounts, such as income and capital accounts, and foreign accounts are also consistent and consistent with MNA.
Accuracy and reliability
-
Sources of error and uncertainty
-
The national accounts are based on various statistical sources. The sources are either survey data from establishments, enterprises or households, or data from registers. National accounts statistics reflect the inaccuracy in the statistical sources and the methods of compilation. Weaknesses and inaccuracy in the statistical sources are normally described in the documentation of the relevant sources.
Since the national accounts are an integrated system with balancing methods and consistency checks, the national accounts may reduce some of the inaccuracies in the statistical sources. On the other hand, national accounts require the compilation of statistics in areas where the sources are unsatisfactory, and the inaccuracy in such areas may therefore be significant. Some of the figures in the national accounts are estimated as residuals, and the uncertainty may be substantial in these areas. Examples are the compilation of changes in inventories and operating surplus by activity.
The EU Commission and Eurostat have completed a quality evaluation of the national accounts in all EEA countries. The conclusion was that "The Norwegian national accounts are of a high quality, soundly based on reliable and exhaustive sources, integrated in a system with a detailed product breakdown". (Report on the sources and methods used in compiling GNP in Norway, Eurostat/B1/CPNB/237/EN, 9 December 1997, Luxembourg.)
The International Monetary Fund (IMF) completed an evaluation of central parts of Norwegian macroeconomic statistics in autumn 2002, including the Norwegian national accounts. In the report IMF (2003), the Norwegian macroeconomic statistics, including the national accounts, got positive reviews: "In summary, Norway's macroeconomic statistics are of generally high quality." About the national accounts, the IMF also expressed that: "The source data for both the annual and the quarterly national accounts are generally sound and timely, and sufficiently portray reality."
The production of several of the sources that are used in the national accounts takes a considerable amount of time. Consequently, preliminary figures are more inaccurate than final figures.
In 2003, Statistics Norway carried out a project to evaluate the quality of the Norwegian QNA. The task of the project was to describe and evaluate the different processes in the system, and set up a plan for further work to improve quality. A project report was released in April 2004 (in Norwegian only). The report lists a variety of measures to increase quality, such as changes in the organisation of the QNA process, technical changes in the data system, an increase and improvement of the documentation related to the QNA system etc.
Another way of measuring the general quality of the QNA figures is to compare the preliminary annual figures from the first version of the annual accounts (by adding up the quarters in the QNA) with the final version. This was done in 2004. The article (in Norwegian only) looks at the growth rates of the main aggregates: GDP, GDP for mainland Norway, household consumption, government consumption, gross fixed capital formation, exports, imports and compensation of employees. For most variables, the study covers the years 1972-2002, while for some variables it covers the years 1993-2002. The study concludes that the preliminary figures generally had underestimated the growth rate in relation to the final figures, but that the overall picture did not differ too much.
-
Revision
-
The national accounts data for a specific month, quarter or year are revised in accordance with an ordinary publication and revision cycle. The monthly and quarterly figures within a specific year t have the status final 21 months after the end of the year. See Administrative information, Frequency and timeliness. In addition, periodical main revisions give revised figures. See Background and purpose. The table below shows the publication cycle for yearly and quarterly national accounts figures. In addition to what is stated in the table, monthly data will be published about 40 days after the end of the month. In May, year t (which coincides with the QNR for the first quarter), all months, also in year t-1, can be revised. After May year t, only the monthly figures for the current year are subject to revision.
Publication cycle for quarterly and yearly national accounts figures
Release date in:
1st quarter year t
2nd quarter year t
3rd quarter year t
4th quarter year t
May, year t
First preliminary version
Revised 3 for year t-1
Revised 2 for year t-1
Revised 1 for year t-1
August, year t
Revised 1
Revised 5 for year t-1
Final for year t-2
First preliminary version
Revised 4 for year t-1
Final for year t-2
Revised 3 for year t-1
Final for year t-2
Revised 2 for year t-1
Final for year t-2
November, year t
Revised 2
Revised 1
First preliminary version
Revised 3 for year t-1
February, year t
Revised 3 for year t-1
Revised 2 for year t-1
Revised 1
First preliminary version for year t-1
Relevant documentation
- Goods sent abroad for processing and merchanting in the Norwegian national accounts. Notater (2015/02)
- Process tables in the Norwegian national accounts. Notater (2015/03)
- Improved treatment of insurance in the Norwegian national accounts. Notater (2015/04)
- Changes in inventories in the Norwegian National Accounts - Accounting data as a source for changes in inventories. Notater (2017/13)
- Quarterly national accounts - methods and sources of the quarterly national accounts compilations for Norway December 2013. Notater (2014/02)
- Planned changes in the national accounts statistics
- Revised national accounts figures 1970-2010
- History of national accounts in Norway - from free research to statistics regulated by law. Notater (113)
- Norwegian National Accounts - GNI Inventory for ESA95
- Norwegian methodology for supply and use tables and input-output tables. Notater (2009/8)