Content
Published:
This is an archived release.
A few museums had half of the visitors
3 per cent of the museums had almost the half of the visits in Norwegian museums in 2001. 7 per cent of Norwegian museums are Oslo, but still they had over 37 per cent of the visitors. 29 per cent of Norway's museums had less than 1 000 visits during the year.
The museum statistics for 2001 cover 521 Norwegian museums, but 13 of these had not been open to the public. The open museums had in total more than 8.5 million visits.
The smallest museums, with under 1 000 visits, represented about 29 per cent of the museums and had only 0.7 per cent of the total visits to the museums.
Most social history museums
417 of the museums were social history museums, and these museums had about 60 per cent of all visits. The art museums had just below 15 per cent of the visits.
The open museums had more than 8.5 million visits. More than half of them, 4.4 millions visits, are registered as individual visits, and the rest of the visits were persons in groups.
Most museums in Hordaland
The museums in Oslo had just over 37 per cent of the visits, whereas only 7 per cent of the museums in the statistics are located in Oslo. For the last few years Hordaland has had the highest share of museums, and in 2001 this county had 10 per cent of the open museums and about 12 per cent of all visits. The museums in Aust-Agder had fewest visitors with only 0.7 per cent of all the visits, whereas 4 per cent of the museums are located in this county.
27 million objects
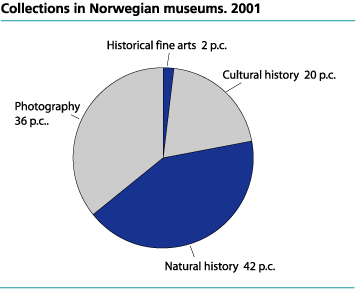
The size of the registered collections at the Norwegian museums is increasing. Around 27 million objects were registered at the open museums in 2001. 11.4 million objects were natural history objects, 5.5 million were cultural history objects, whereas approximately 520 000 were historical fine art objects. In addition the museums had about 10 million photographs.
The open museums at the same time administered 5 641 buildings and structures worthy of preservation. Social history museums had about 90 per cent of the buildings and structures worthy of preservation. The museums in Rogaland administered the highest number of these buildings, above 14 per cent.
3 100 exhibitions
The open museums had 3 068 exhibitions in 2001, whereas the closed museums had 15 exhibitions. Social history museums had a total of 2 290 exhibitions, whereas art museums had 239 exhibitions. The museums in Nordland had the highest number of exhibitions, about 11 per cent. The museums in Oslo had 9.4 per cent of the exhibitions, closely followed by Hordaland with 9.3 per cent.
Of the exhibitions, 1 982 were basic exhibitions, about 870 were temporary exhibitions and 220 were travelling exhibitions.
9 per cent of revenues from tickets
The museums included in the survey had a total of NOK 1.83 billion in total revenue. Public contributions comprised 65 per cent of the museums revenues, whereas ticket revenues comprised around 9 per cent. The rest of the revenues were other revenues with 21 per cent and revenues from gifts, funds and sponsors represented, with about 5 per cent. The museums in Aust-Agder had 90 per cent of the revenues from public contributions, whereas the museums in Møre og Romsdal had the lowest subsidies, at around 56 per cent, and the highest share of ticket revenue, at around 20 per cent. Østfold had just over 2 per cent of the revenues from ticket sales. Total expenditure for the museums in 2001 was NOK 1.79 billion.
More than 3 000 man-years
In 2001, 3 272 man-years were worked in these museums. Of these, 3 012 were remunerated man-years and 2 144 of these man-years were by permanent employees.
The number of museums and which museums that are reporting to the museum statistics, changes somewhat from year to year. For that reason it is not possible to provide any comparisons from previous years.
We will later on publish figures for the largest museums, which can be compared over years.
Tables:
- Table 1 Museums and collections. Visits and exhibitions. 2001
- Table 2 Museums and collections. Size of collections. 2001
- Table 3 Museums and collections. Finance, employment position and man-years. 2001
- Table 4 Museums and collections, by form of organisation. Revenues and public contributions. 2001
- Table 5 Museums and collections. Visits and exhibitions after visits. 2001
Contact
-
Hilde Sofie Frydenberg
E-mail: hilde.frydenberg@ssb.no
tel.: (+47) 40 81 13 50
-
Elisabeth Haraldsrud
E-mail: elisabeth.haraldsrud@ssb.no
tel.: (+47) 40 81 15 00
-
Elin Såheim Bjørkli
E-mail: elin.saheim.bjorkli@ssb.no
tel.: (+47) 40 81 13 53

