Content
Published:
This is an archived release.
Sales value of manufactured goods rose
Sales of goods from manufacturing, mining and quarrying were up 4.8 per cent from 2010 to 2011. The total value of manufacturing and mining was NOK 620 billion, the highest level since 2008.
Refined petroleum, chemicals and pharmaceutical industry showed the best growth in 2011, with an increase of over 18 per cent and almost NOK 21 billion. This increase must be seen in the context of the relatively strong prices for oil and petroleum. The price increase in this sector was almost 25 per cent from 2010 to 2011 (see Producer price index ). For the machinery and equipment industry, there was a decline in sales of manufactured goods of nearly 13 per cent from 2010 to 2011. The level was about 23 per cent lower than the record year 2009. The paper and paper products industry fell by nearly six per cent from 2010 to 2011.
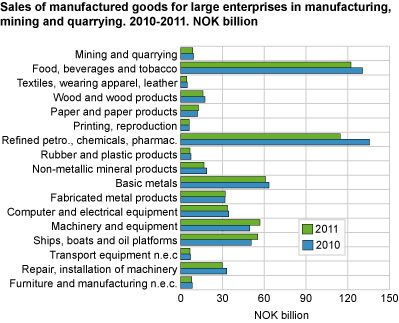
Building of ships, boats and oil platforms decreased by over eight per cent from 2010 to 2011, while the industry for repair and installation increased sales by 11 per cent. Much of the activity in the industry, shipbuilding and oil platforms comes from commodity codes under repair and installation. Commodity statistics collect codes, which are aggregated to industry figures. This means that much of the growth in the repair and installation comes from companies in the construction of ships, boats and oil platforms.
In total there were four industries that experienced a decrease in sold production from 2010 to 2011, while there were 13 that showed growth. The increase in oil refining, chemical and pharmaceutical industries accounted for over 73 per cent of the overall increase in the sales of manufactured goods for the manufacturing industry from 2010 to 2011.
Food, beverages and tobacco fall from top
Food, beverages and tobacco showed an increase of almost 7 per cent in sales from 2010 to 2011. The level of over NOK 130 billion is the highest ever recorded for the industry. However, in 2011, manufacturing sales from oil refining, chemical and pharmaceutical industries were over NOK 135 billion, becoming the largest industry in the manufacturing industry in terms of sales of manufactured goods, and also the highest observed level for a single industry ever in these statistics.
|
Manufacturing statistics are based on information from the 2 120 largest enterprises classified in manufacturing, mining and quarrying. These enterprises accounted for approximately 93 percent of total manufacturing in 2010. These statistics are published yearly in agreement with Eurostat and the data is also used in the national accounts. The figures in these statistics are from commodity data, which in turn are aggregated up to industry statistics. As a result, much of the increase in repair, installation of machinery was due to activity outside this industry. |
Tables:
Find more figures
Find detailed figures from Production of commodities in manufacturing, mining and quarrying
Contact
-
Elisabeth Helgeberg
E-mail: elisabeth.helgeberg@ssb.no
tel.: (+47) 92 81 98 88
-
Samuel Abonyo
E-mail: samuel.abonyo@ssb.no
tel.: (+47) 40 81 14 95