Content
Published:
This is an archived release.
Sales value of manufactured goods up
Sales of manufactured goods from manufacturing, mining and quarrying were up 2.6 per cent from 2013 to 2014. The total value of manufacturing and mining was NOK 689 billion.
| 2013 | 2014 | Change in per cent | |
|---|---|---|---|
| Value (1 000 NOK) | Value (1 000 NOK) | 2013 - 2014 | |
| Manufacturing, mining and quarrying | 671 519 578 | 689 065 476 | 2.6 |
| Mining and quarrying | 9 499 876 | 9 966 848 | 4.9 |
| Manufacturing | 662 019 702 | 679 098 628 | 2.6 |

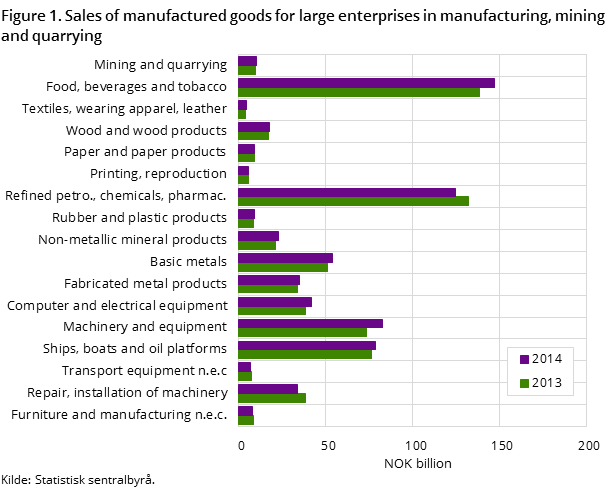
Sales were greatest in the machinery and equipment industry, with a growth of over 13 per cent, or NOK 9.5 billion. This follows developments observed since 2011. The industry contributes approximately 54 per cent of the total increase for manufacturing, mining and quarrying as a whole.
Computer and electrical equipment industries showed an increase of 9.8 per cent or NOK 3.7 billion. Basic metal industry rose 5.9 per cent or NOK 3 billion. This is approximately 32 per cent or NOK 25 billion lower than the peak sales in 2007.
The decline in repair, installation of machinery was 12 per cent or NOK 4.8 billion; this must be seen in connection with the increase in the building of ships and oil platforms of 2.9 per cent or NOK 2.2 billion. These two industries are closely linked in the way these statistics are made on the basis of production codes. The activity of an enterprise can be in both of these industries or switch between these two industries.
Overall, 12 industries had an increase in sold production from 2013 to 2014, and only four showed a decline.
Food, beverages and tobacco had greatest increase
Food, beverages and tobacco showed an increase in sales of about 6 per cent from 2013 to 2014, and sold for a total of NOK 147 billion. Over two-thirds of the increase was from the processing and preserving of fish, crustaceans and molluscs.
Oil refining, chemical and pharmaceutical industries showed a decline of just over 4.5 per cent, or NOK 7.4 billion, and this is its third consecutive year of decline. Part of the explanation may lie in the decline in oil prices from 2013 to 2014, which is reflected in lower prices for refined petroleum products.
Find more figures
Find detailed figures from Production of commodities in manufacturing, mining and quarrying
Contact
-
Elisabeth Helgeberg
E-mail: elisabeth.helgeberg@ssb.no
tel.: (+47) 92 81 98 88
-
Samuel Abonyo
E-mail: samuel.abonyo@ssb.no
tel.: (+47) 40 81 14 95
