Content
Published:
This is an archived release.
Increasing energy consumption in 2015
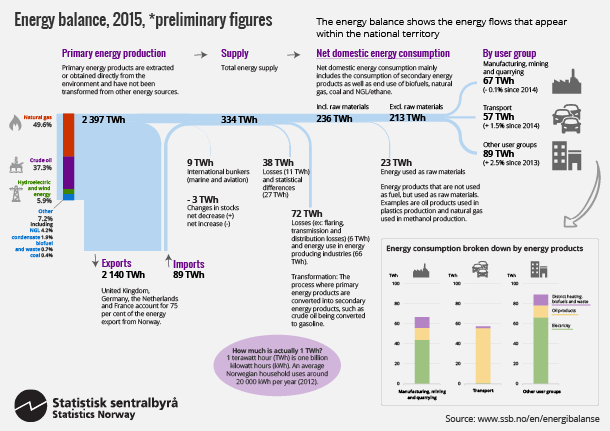
In 2015, the total domestic energy consumption, excluding the energy industries and consumption of raw materials, was 213 TWh. This is 1.5 per cent more than the year before.
| All energy products | Change in per cent | ||
|---|---|---|---|
| 2014 | 2015 | 2014 - 2015 | |
| Primary energy production | 2 284 | 2 397 | 4.9 |
| Imports | 76 | 89 | 17.4 |
| Exports | 2 032 | 2 140 | 5.3 |
| International bunkers (marine and aviation) | 10 | 9 | -14.0 |
| Changes in stocks (+ = net decrease,- = net increase) | 7 | -3 | -146.7 |
| Total energy supply | 325 | 334 | 2.8 |
| Energy industries own use and energy converted | 68 | 72 | 6.1 |
| Losses and statistical differences | 36 | 38 | 7.1 |
| Final consumtion including non-energy use | 232 | 236 | 1.8 |
| Non energy use | 22 | 23 | 5.1 |
| Final consumtion excluding non-energy use | 210 | 213 | 1.5 |
| Manufacturing, mining and quarrying | 67 | 67 | -0.1 |
| Transport | 56 | 57 | 1.5 |
| Other sectors | 87 | 89 | 2.7 |
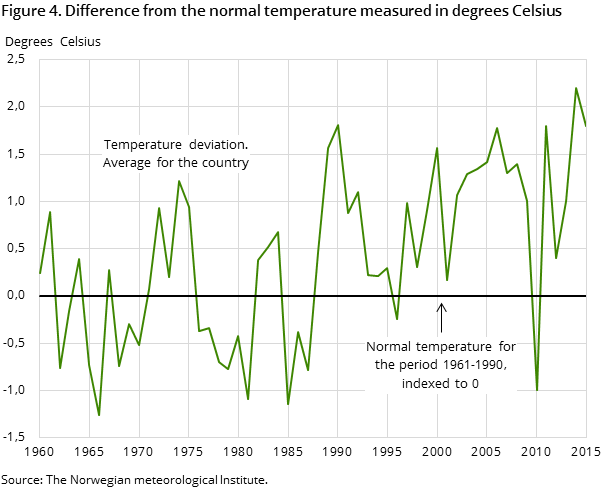
The increase in energy consumption must be viewed in conjunction with the historically high temperatures in 2014, which were 2.2 degrees above the normal temperature. This led to a drop in the energy consumption in this year. 2015 was also warm, but not as warm as 2014. According to the Norwegian Meteorological Institute, 2015 was 1.8 degrees above what is considered the normal temperature, and was the third warmest year in a time series that goes back to 1900.
Increased energy consumption for households and services
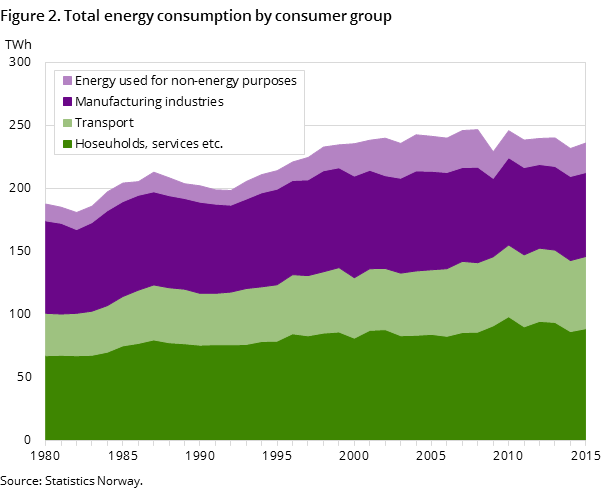
Net domestic energy consumption, i.e. excluding consumption in energy producing industries and energy used as raw materials, is divided into three main groups; manufacturing industries, transport purposes and "other sectors". These made up 31, 27 and 42 per cent respectively of consumption in 2015. In addition, some energy is used as raw material. This made up 23 TWh in 2014, but this is separated from other consumption in the energy balance and is not included in other figures presented in this text.
Energy consumption in the group "other sectors" is dominated by households and services. The consumption of electricity, which accounts for 75 per cent of the energy consumption in “other sectors”, increased by 3 per cent from 2014. There was also a 10 per cent increase in the consumption of biomass. The consumption of petroleum products such as kerosene and heating oil fell by 3 per cent in the same period.
Higher consumption of fuel wood
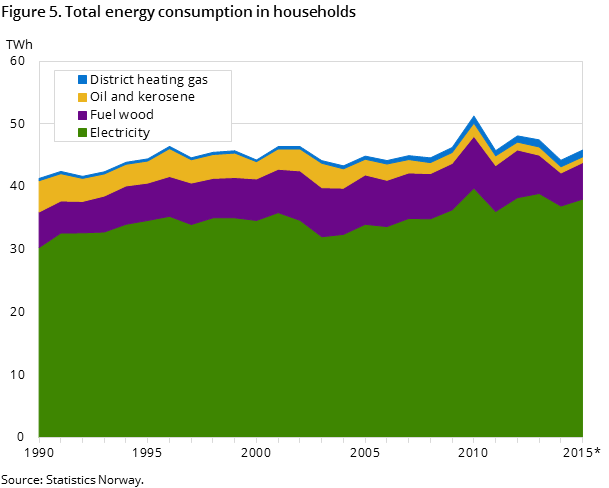
About 12 per cent of households’ energy consumption comes from fuel wood. In 2015, slightly more than 1.2 million tonnes of fuel wood was burned. Compared with 2014, fuel wood consumption in houses and holiday houses rose by 10 per cent. On million tonnes was burned in permanent houses, while 0.2 million tonnes was burned in holiday houses. In spite of the increase, the consumption in 2015 is the second lowest consumption that has been calculated since this survey started in 2005.
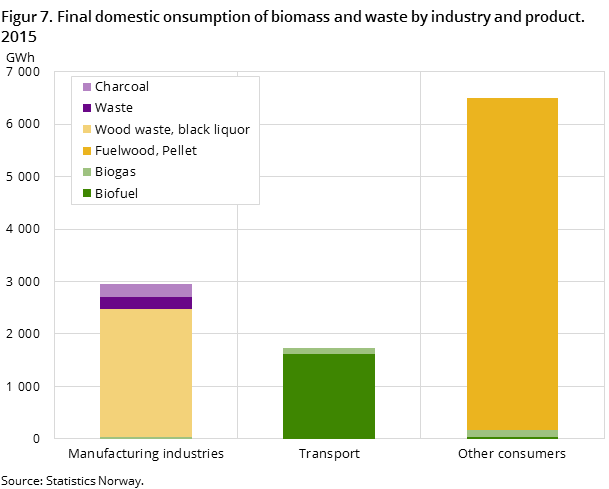
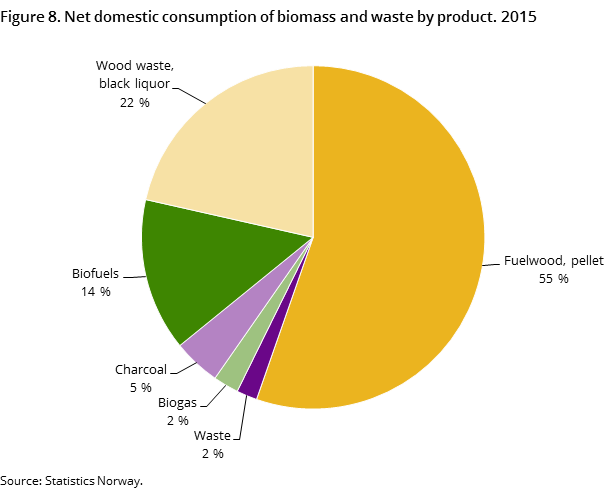
Fuel wood is the most common biomass product in Norway, and made up half of the total consumption of biomass in the country, followed by wood waste in manufacturing industries, which made up 22 per cent. Next was biofuel used in transport, which made up 14 per cent.
Lower gasoline consumption, but more cars using diesel and electricity
In 2015, the energy consumption for transport purposes was around 57 TWh, which was 1.5 per cent above the level in 2014. Gasoline consumption has fallen in recent years, and in 2015 dropped by a further 6 per cent from the year before. The decline is due to the growth in the use of diesel cars and fewer gasoline cars. Consumption of diesel has risen steadily in recent years and in 2015 was about 3 per cent above the level in 2014. About 190 million litres of biofuels were used in 2015, which is 10 per cent more than in the previous year. This made up 4.6 per cent of total gasoline and dutiable autodiesel consumption. The corresponding share in 2014 was 4.2 per cent. The requirement for oil companies to mix biofuels with fossil fuels was increased from 3.5 to 5.5 per cent on 1 July 2015.
The consumption of heavy fuel oil fell sharply to 46 000 tonnes in 2015, which is a third of the 2014 level. Heavy fuel oil is mainly used in shipping and fishing in addition to manufacturing industries. The reason for the drop in consumption may be a political wish to change to more environmentally friendly fuel with a lower sulphur content. International laws forbidding the use of fuel with a high sulphur content came into force in January 2015.
There is also some consumption of natural gas in inland shipping, mainly LNG. This consumption rose by around 7 per cent from the previous year, which indicates a change from consumption of oil to gas in shipping in 2015. Natural gas made up about 15 per cent of the total energy consumption here.
More electric cars
There has been a sharp increase in the number of electric vehicles in 2015, and the number of electric private cars came to 69 000. On average, these cars were driven around 13 000 km in the year, and the estimated electricity consumption for these cars was around 180 GWh, based on the assumption that they use about 0.2 kWh per km. In addition, there are some electric buses, lorries and motor cycles. In total, electric cars made up 2.6 per cent of all vehicles in 2015.
Unchanged energy consumption in manufacturing industries
Preliminary figures show roughly unchanged energy consumption in industry, but the development varied for different energy products. Consumption of electricity, which is also the main energy source in industry, decreased by 0.4 per cent, while the use of biomass rose by about 10 per cent. There was also a large increase in the use of LPG (propane etc.) for energy purposes from 2014, by around 20 per cent. This spending accounted for barely 3 per cent of the industry's total consumption in 2015. Most of the LPG used in industry is used as a raw material in the production of chemical raw materials.
More use of biogas
Biogas comes mainly from fermentation without oxygen of organic waste, sewage sludge, food waste and manure. It can be used as fuel for transport purposes, as an input in heating, electricity generation or industrial purposes or for heating. It is a political goal to increase the use of biogas in Norway since it can replace fossil fuels, at the same time avoiding some of the emissions to air from the methane in biogas when it is burned. A comprehensive survey of biogas use in Norway was conducted in 2015. The results showed a biogas consumption in Norway of 308 GWh. Of this, around 48 GWh was used in district heating or power generation. The rest was in industry (30 GWh), 105 GWh in transport and 126 GWh in other consumer groups. Biogas accounted for about 2 per cent of total biofuel consumption in 2015. Compared with 2014, biogas consumption doubled, but the increase is also due to a larger sample of biogas producers in the 2015survey.
Increase in Norway's share of renewables
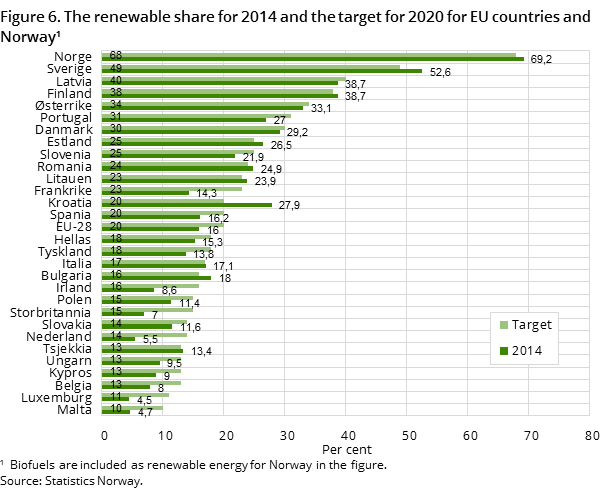
From 2013 to 2014, Norway’s share of renewables rose from 66.7 to 69.2 per cent, which is 2 percentage points above the target of 67.5 per cent. This is partly due to how the share is calculated. 2014 was a warm year, which led to a drop in the energy consumption. This reduced the denominator, which consists of total energy consumption. The numerator in the share, which mainly consists of normalised hydro power production, increased somewhat from 2014 to 2015, and this pushed up the share considerably.
The renewable share for transport was 4.8 per cent in 2015. Since 2011, countries have been required to have documentation confirming that biofuels meet certain sustainability criteria. This documentation was available for Norway for the first time in 2014, and can now therefore be included in the official renewable shares for Norway. The renewable share for 2015 will be calculated during the winter 2016/2017, when all necessary data are available.
This page has been discontinued, see Production and consumption of energy, energy balance and energy account, Annually.
Contact
-
Malin Bjelvert
E-mail: malin.bjelvert@ssb.no
tel.: (+47) 40 81 15 02
-
Sigrun Kristoffersen
E-mail: sigrun.kristoffersen@ssb.no
tel.: (+47) 48 00 21 92
-
Ann Christin Bøeng
E-mail: ann.christin.boeng@ssb.no
tel.: (+47) 40 81 13 58

