Content
Published:
NB! Not updated for 2019. Please see The Norwegian Directorate of Elections for 2019 results. https://valgresultat.no
Voter turnout highest among women
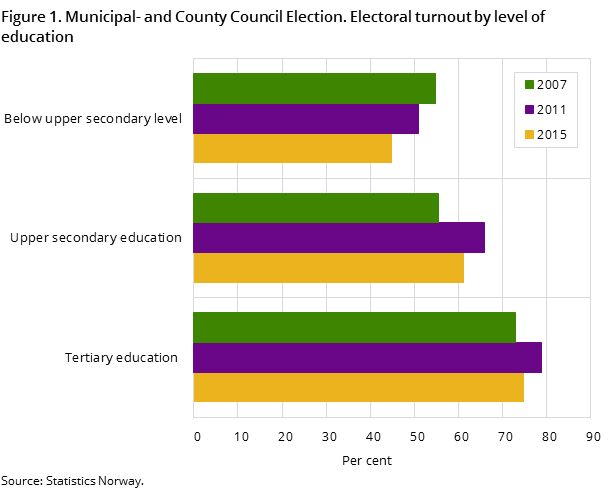
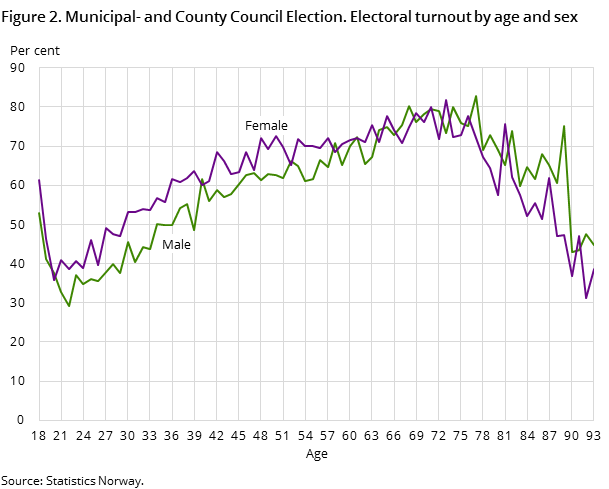
The turnout in the 2015 elections was 62 per cent among women and 57 per cent among men. Among the over 67s, however, participation is higher among men. Among those with a tertiary education, almost 8 out of 10 voted, while among those without an upper secondary education only 5 out of 10 voted.
| 2007 | 2011 | 2015 | |
|---|---|---|---|
| Corrected 19 February 2016. | |||
| Total | 61.7 | 64.5 | 60.2 |
| Males | 60.5 | 62.9 | 57.2 |
| Females | 62.8 | 66.9 | 62.0 |
| Both sexes | |||
| 18-19 years | 34.8 | 49.4 | 48.3 |
| 20-24 years | 34.7 | 39.5 | 36.4 |
| 25-44 years | 54.8 | 57.7 | 51.5 |
| 45-66 years | 67.3 | 71.5 | 67.7 |
| 67-79 years | 71.4 | 76.3 | 75.9 |
| 80 years or older | 63.1 | 60.1 | 56.8 |
| Males | |||
| 18-19 years | 38.9 | 46.2 | 44.1 |
| 20-24 years | 34.7 | 36.0 | 34.0 |
| 25-44 years | 51.8 | 54.4 | 47.5 |
| 45-66 years | 66.3 | 70.8 | 65.2 |
| 67-79 years | 73.4 | 77.8 | 77.0 |
| 80 years or older | 66.2 | 65.7 | 62.8 |
| Females | |||
| 18-19 years | 31.2 | 54.1 | 52.9 |
| 20-24 years | 34.6 | 43.0 | 38.9 |
| 25-44 years | 57.9 | 61.5 | 55.6 |
| 45-66 years | 68.5 | 72.2 | 70.3 |
| 67-79 years | 69.9 | 75.0 | 74.9 |
| 80 years or older | 60.9 | 57.1 | 53.1 |
The electoral turnout among people with a tertiary education was 75 per cent. For those with an upper secondary education the turnout was 61 per cent, while for those without an upper secondary education the turnout was 45 per cent. This was the same trend as in the local elections in 2007 and 2011, but the difference has increased over the years.
Turnout declined in most groups
In the last local elections in 2011, the overall turnout increased by 5 percentage points compared to the local elections in 2007. In this year’s elections, the turnout decreased by almost 5 percentage points. The decline appeared in most groups.
4 out of 10 immigrants with a Norwegian passport voted
Forty per cent of immigrants who are now Norwegian citizens voted in the local elections. Among Norwegian citizens without an immigrant background, 64 per cent voted in the election.
3 out of 10 foreign citizens voted
The turnout among foreign citizens was 29 per cent; about the same as in previous local elections.


This page has been discontinued, see Election results for municipal and county council election, Every four years.
Contact
-
Øyvin Kleven
E-mail: oyvin.kleven@ssb.no
tel.: (+47) 45 88 89 37
-
Espen Andersen
E-mail: espen.andersen@ssb.no
tel.: (+47) 92 61 00 46
-
Statistics Norway's Information Centre
E-mail: informasjon@ssb.no
tel.: (+47) 21 09 46 42
