Content
Published:
This is an archived release.
Almost NOK 100 million in donations to political parties
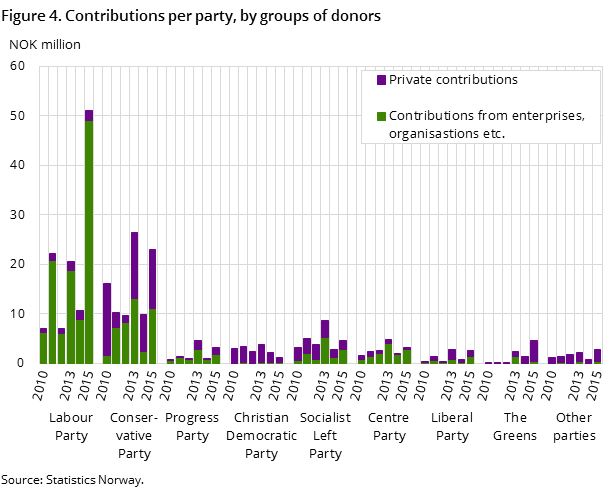
Political parties received about NOK 97 million in donations from private donors, organisations and commercial enterprises last year, which is NOK 66 million more than in 2014 and NOK 21 million more than in the parliament election year 2013.
| 2015 | ||
|---|---|---|
| Total | Per cent | |
| Income, total | 699 432 768 | 100.0 |
| Government subsidy, total | 471 537 423 | 67.4 |
| Central government subsidy | 389 930 043 | 55.7 |
| Municipal/county subsidy | 65 911 269 | 9.4 |
| Other government subsidy | 15 696 111 | 2.2 |
| Total | ||
| Own business, total | 131 226 736 | 18.8 |
| Membership fee | 55 450 757 | 7.9 |
| Income from lotteries and similar | 18 735 406 | 2.7 |
| Capital income | 14 990 819 | 2.1 |
| Business activity | 17 683 922 | 2.5 |
| Other income from own business | 24 365 832 | 3.5 |
| Contributions, total | 96 668 609 | 13.8 |
| Private contributions | 26 704 963 | 3.8 |
| Contributions from commercial enterprises | 14 423 317 | 2.1 |
| Contributions from employers' and labour organizations | 45 608 288 | 6.5 |
| Contributions from other | 9 932 041 | 1.4 |
Never before have the donations made up a share at this level of total income. 2015 was a municipal and county election year – and the donations made up 14 per cent of the income of the political parties. In the parliament election year 2013 the share was 12 per cent, and in non-election years the share has been 7 per cent and lower. Public funding made up 67 per cent of the total income of the political parties in 2015 and is the most important source of income.
Labour received more than 50 per cent of all donations
In 2015, the Labour Party received more than NOK 51 million in donations, of which NOK 40.5 million was from labour unions. The Conservatives were credited with NOK 23 million in 2015, of which NOK 12 million was from private donors and NOK 10.5 million from enterprises. A considerable part of the contributions to the Labour Party was donations to its youth organisation in connection with the reconstruction of the political education campus at Utøya after the terror attack in 2011.
Total income up 55 per cent since 2005
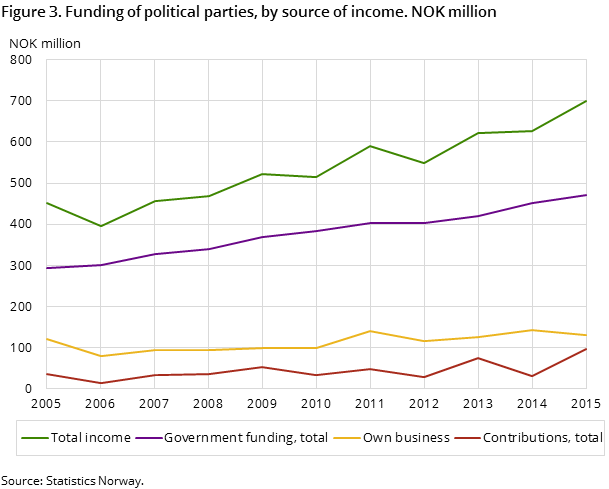
In total, the income of units of the political parties that are obliged to report their finances comprehensively amounted to NOK 699 million. Of this, NOK 472 million was public funding, and mainly central government subsidies, which made up NOK 390 million.
Compared to 2005, i.e. the first year reported, the total income has increased by 54.9 per cent. During the same period, the consumer price index has increased by 21.5 per cent. In relative terms, the donations have increased the most by far, 173 per cent from NOK 35 million to NOK 97 million. At the same time, public funding has increased by 60 per cent.
Public funding makes up two thirds of the income
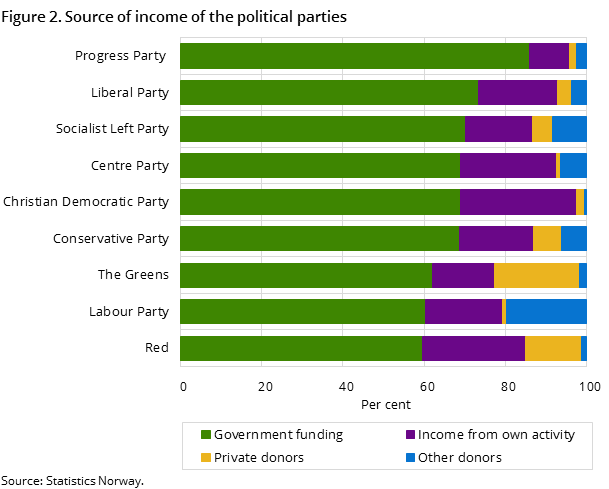
Overall, two thirds of the income of the political parties was public funding. The Progress Party stands out with public funding making up 86 per cent of its total income in 2015. No other party reaches this level. The Pensioners' Party received 79 per cent of its income from the public, and the Conservatives 69 per cent. The relatively low level of 60 per cent for the Labour Party has to be seen in connection with the big contributions to its youth organisation.
Influenced by the interest rate
Compared with 2014, income from own business such as membership fees, income from lotteries and business activities has contributed NOK 23 million, i.e. a growth of 25 per cent. On the other hand however, capital income has decreased from NOK 51 million in 2014 to NOK 15 million in 2015, mainly due to especially high gains in 2014 and sharply decreasing interest rates in 2015.
High losses in 2015
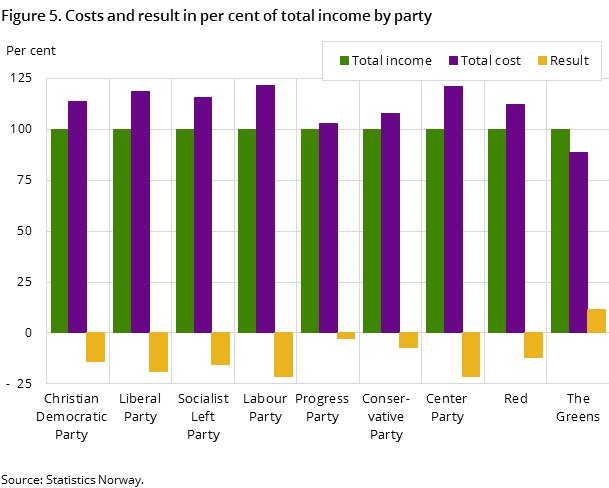
In the statistics, internal incomes and costs between the units within a party are not taken into consideration, in total these should balance. Aggregating the costs this way sums up to a total of NOK 795 million, causing a total loss of NOK 95 million for those parties which have reported their finances comprehensively. This means a loss of 14 per cent and sharp decline compared to 2014, which gave a total gain of NOK 106 million.
Election campaign and costs
Salary costs increased by some 13 per cent to a total of NOK 270 million in 2015, of which NOK 105 million is allocated to the Labour Party. Other operating costs have increased by 87 per cent to a total of NOK 519 million for all parties. The operating costs in the Labour Party in particular have seen strong growth, from NOK 90 to 191 million. This too is partly due to the reconstruction of Utøya. It should generally be assumed that the election campaign in 2015 has significantly driven the costs to this level.
6 of 10 NOK on political work
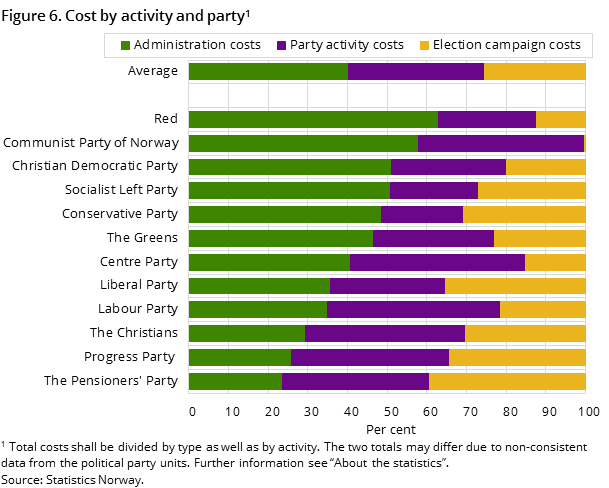
The costs are also divided by activity. This classification shows that NOK 474 million is used on political tasks and some NOK 319 million on administration. Thus the costs for political tasks make up 6/10 of total costs in the political parties, and administration 4/10. The Progress Party and the Pensioners' Party have the highest share of costs used on political tasks, about 3/4 of total cost and the rest used on administration.
Comparison with 2014
When interpreting the development from 2014 to 2015 it should be borne in mind that the changes to some extent may be due to changes of accounting principles. The principles in the Political Party Act differ from those of the Accounting Act. It is to be assumed that the reporting units have followed the principles of the Political Party Act in 2015 to a greater extent than in previous years. In this case, income as well as cost will be calculated with higher amounts in 2015 since the Political Party Act require gross accounting and that all transactions are entered in the profit and loss account and not only in the balance sheet, which in some cases is permitted according to the Accounting Act.
781 units make up the basis for the statisticsOpen and readClose
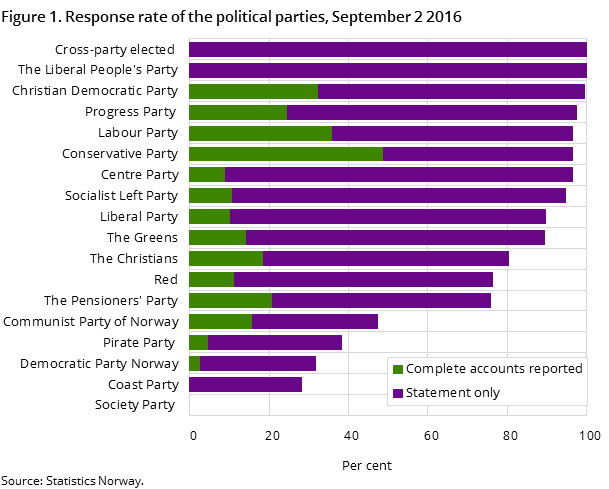
By 2 September 2016, a total of 3 154 units had submitted their reports or statements, giving a response rate of 91.3 per cent. 302 units have not answered the questionnaire. 783 units reported their finances comprehensively according to the Act, i.e. complete accounts. The statistics are based on the reports from 781units of the political parties, 2 units represent parties with less than 3 units reporting full accounts. These units are not included in the statistics.
Figure 1 shows the response rate of the political parties up to and including 2 September. It also shows whether they have reported comprehensively or if they have submitted a statement specifying that their non-governmental income was less than NOK 12 000.
Read more about the data basis in section 5 in About the statistics.
Contact
-
Terje Risberg
E-mail: terje.risberg@ssb.no
tel.: (+47) 92 62 81 09
-
Tove Bergseteren
E-mail: tove.bergseteren@ssb.no
tel.: (+47) 99 79 08 19
-
Statistics Norway's Information Centre
E-mail: informasjon@ssb.no
tel.: (+47) 21 09 46 42
