Content
Published:
This is an archived release.
NOK 450 million in government subsidies to political parties
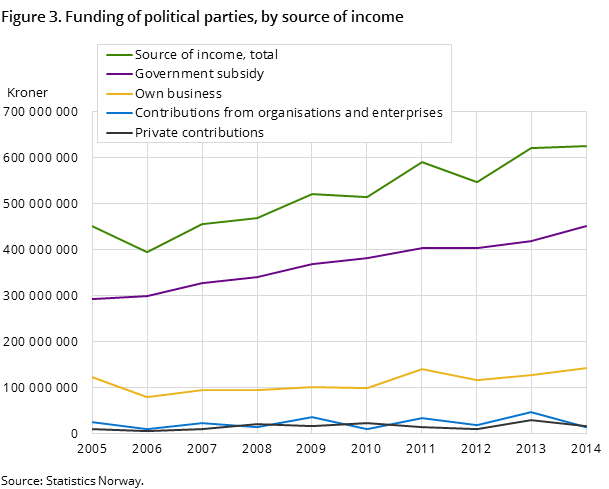
The income of the political parties totalled NOK 626 million in 2014; an increase of almost NOK 4 million from 2013. The donations decreased by NOK 45 million, government subsidies increased by NOK 32 million and own business income was up NOK 17 million from 2013.
| 2014 | ||
|---|---|---|
| Total. NOK | Total. Per cent | |
| Income, total | 626 147 384 | 100.0 |
| Government subsidy, total | 451 332 886 | 72.1 |
| Central government subsidy | 375 759 566 | 60.0 |
| Municipal/county subsidy | 63 320 069 | 10.1 |
| Other government subsidy | 12 253 251 | 2.0 |
| Own business, total | 143 630 610 | 22.9 |
| Membership fee | 50 425 932 | 8.1 |
| Income from lotteries and similar | 15 145 781 | 2.4 |
| Capital income | 50 874 157 | 8.1 |
| Business activity | 10 852 450 | 1.7 |
| Other income from own business | 16 332 290 | 2.6 |
| Contributions, total | 31 183 888 | 4.9 |
| Private contributions | 15 928 787 | 2.5 |
| Contributions from commercial enterprises | 3 256 831 | 0.5 |
| Contributions from employers' and labour organizations | 10 945 447 | 1.7 |
| Contributions from other | 1 052 823 | 0.2 |
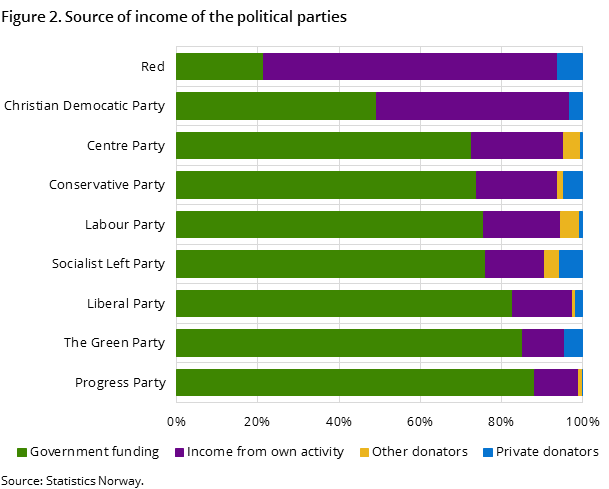
The government subsidy is by far the most important source of income for the political parties, with 72 per cent of their income stemming from public funds in 2014. These totalled NOK 451 million for the units of the political parties that are obliged to report their finances comprehensively. Only the
Christian Democratic Party, Democratic Party of Norway, Red and the Communist Party received less than 50 per cent of their income from public funds. All other parties had a share of 60 per cent or more.
Most of the public funding is disbursed as central government subsidies. This funding increased by NOK 28 million from 2013 to 2014, totalling NOK 376 million. The Labour party received the bigger part, NOK 115 million, and the Conservative Party received NOK 101 million. Thus the Conservatives experienced an increase in central government funding of nearly NOK 29 million, i.e. more than the total increase of this funding. This is related to the increase in the number of votes for the Conservative Party in the Storting election in 2013 compared to the 2009 election. Accordingly, the central government subsidy to the Liberal Party and Norwegian Green Party increased considerably, while the Progress Party received NOK 11 million less and the Socialist Left Party about NOK 4 million less than a year before.
The central government subsidy is very important for the Greens and the Progress Party, making up more than 80 per cent of their income.
Considerable growth in own business income
The political parties carry out business generating income on their own. Members’ fees, lotteries, renting, financial activities etc. totalled approximately NOK 144 million. Members’ fees totalled some NOK 50 million. The Conservatives and the Labour Party collected the bigger share of this, with NOK 12 and 11 million respectively. The Centre Party was next with NOK 7 million.
The capital income increased considerably in 2014 and reached NOK 51 million in total. In 2013, the capital income totalled NOK 29 million. The increase is solely due to income in the Red Party and the Christian Democratic Party.
Decrease in donations
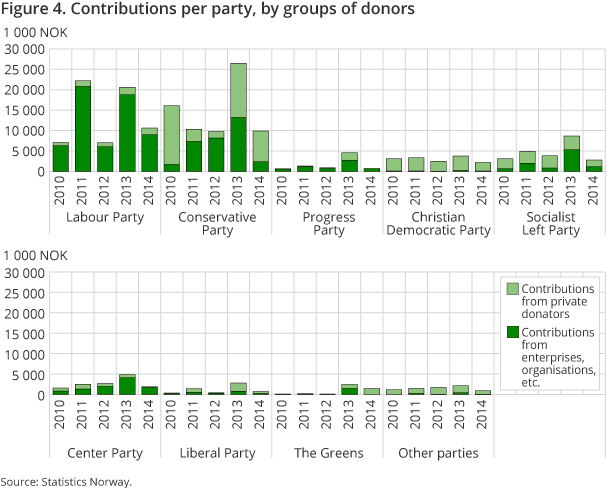
Donations totalled NOK 76 million in 2013 and dropped to NOK 31 million in 2014, which was a year without any elections, whereas parliamentary elections were held in 2013. The share of income fell from 12 to 5 per cent. A share of 5 per cent is quite normal for years without elections, as in 2012 and 2010 the contributions had a share of 5 and 6 per cent.
Private donations and donations from organisations and commercial enterprises contributed approximately the same amounts, with nearly NOK 16 and 15 million respectively in 2014. The Liberals, the Christian Democrats the Conservatives received NOK 10 million from private donors; other donors gave almost NOK 3 million to these parties. For the Progress Party, the proportion is different. This party received almost all donations from ‘other than private persons’; NOK 712 000 in total. ‘Other than private persons’ for these parties are mainly commercial enterprises.
The Labour Party and the Centre party received just some NOK 10 million from organisations and slightly less than NOK 2 million from private donors in 2014. The Socialist Left Party got NOK 1.7 million from private donors and NOK 1.1 million from organisations. Organisations mainly refer to labour unions where these parties are concerned.
Increase in income higher than consumer price index development
In total, the income of the political parties that have reported their finances has increased by 38.7 per cent from 2005 to 2014. During the same period, the consumer price index has increased by 18.9 per cent.
Costs and result
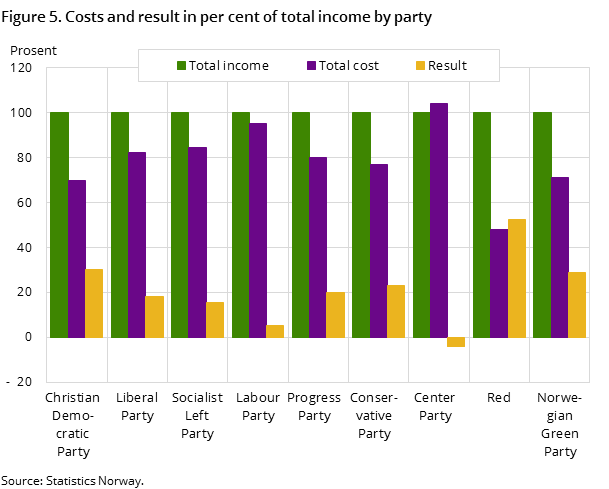
The Political Party Act was revised in 2013. For the first time, costs and balances had to be reported for the financial year 2014. The data material received may indicate that the costs are reported to be somewhat lower than what is actually the case. Aggregations of the costs show that the parties’ total costs made up approximately 83 per cent of the income, giving a result of 17 per cent. On average, the salary costs constituted some 38 per cent of the income.
The Centre Party and the Labour Party stand out. The Centre Party units that have reported their finances had higher costs than income, resulting in a loss of NOK 1.7 million, which corresponds to - 4 per cent of the income. These units of the Centre Party had by far the highest portion of salary costs, at 60 per cent of the income. The Labour Party had costs of 95 per cent of its income, giving a total gain of 5 per cent, i.e. NOK 9.4 million. The Labour Party reported salary costs making up 47 per cent of the income, which is the second highest level.
The Conservative Party and the Red Party reported salary costs of 29 and 20 per cent respectively of the income, which was well below the average. The reports indicate that the Communist Party of Norway, the Democratic Party of Norway and The Liberal People's Party are operated purely as idealist organisations without any salary costs at all.
685 units make up the basis for the statisticsOpen and readClose
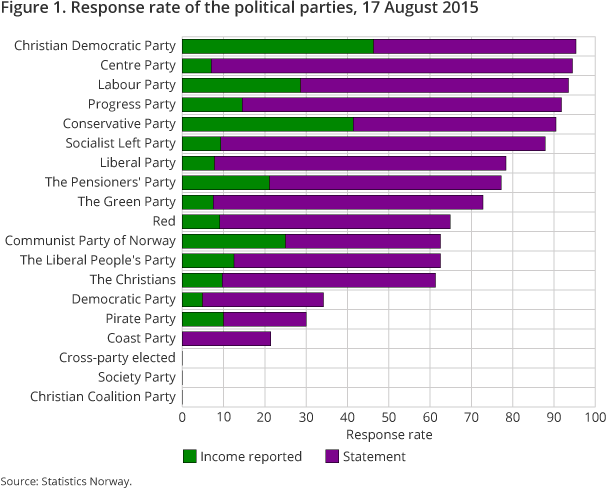
By 17 August 2015, a total of 2 917 units had submitted their reports or statements, giving a response rate of 84.3 per cent. 685 units reported income that meant they were obliged to report their finances comprehensively according to the Act. Thus the statistics are based on the income information from these 685 units of the political parties.
Figure 1 shows the response rate of the political parties up to and including 17 August. It also shows whether they have specified income of NOK 12 000 or more, or if they have submitted a statement specifying that their non-governmental income was less than NOK 12 000.
Read more about the data basis in section 5 of About the statistics.
Contact
-
Terje Risberg
E-mail: terje.risberg@ssb.no
tel.: (+47) 92 62 81 09
-
Tove Bergseteren
E-mail: tove.bergseteren@ssb.no
tel.: (+47) 99 79 08 19
-
Statistics Norway's Information Centre
E-mail: informasjon@ssb.no
tel.: (+47) 21 09 46 42
