Exports and imports
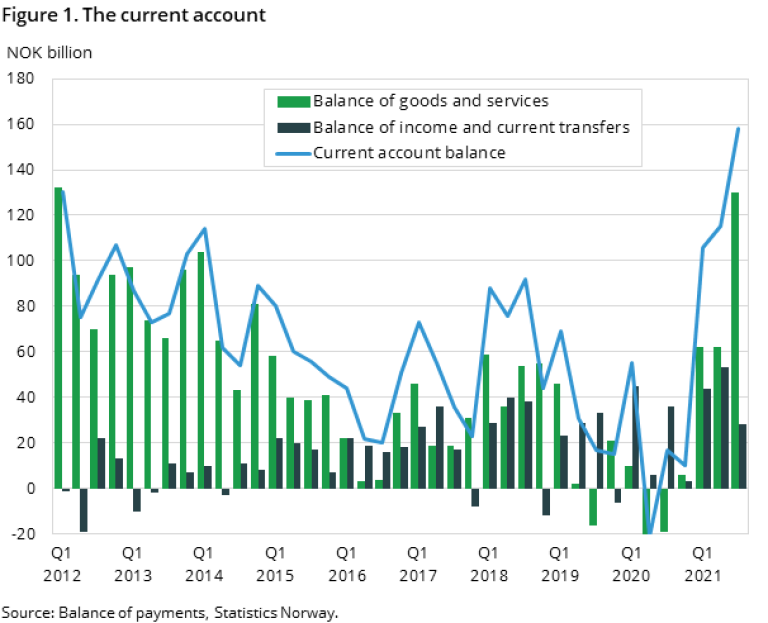
The goods and services balance in the third quarter of 2021 was very high with NOK 130 billion in surplus. The high prices of crude oil and natural gas continued to grow in the third quarter with almost 40 percent from the previous quarter, in particular the natural gas prices contributed to the high price growth. This led to an export income of more than NOK 220 billion. This was about NOK 68 billion higher than in the previous quarter and NOK 140 billion more than in the same quarter in 2020. In addition to the high prices, the large export income from petroleum is explained through higher volumes of exported natural gas. The freight income in shipping has improved much in the third quarter and contributes to the positive development in the balance of services.
There are particular circumstances that have led to higher balance of services during the coronavirus pandemic, and these are mostly caused by the travel restrictions; there is the sharp decline of both exports and imports of travel. The imports of this item consist, slightly simplified, of all costs Norwegians face when traveling abroad. The exports are the opposite. To illustrate, we could say that the import of this item is about NOK 33 billion a quarter on average. The export is NOK 11 billion. This means that we would have an improvement of NOK 22 billion a quarter on average on the balance of services if we exclude travel in the account. During the pandemic most travel abroad stopped both out of the country and into the country, and this has caused an improvement for net lending of more than NOK 100 billion so far. Throughout the third quarter the travel activity grew rapidly and gave rise to exports and imports of travel by NOK 2,3 and 4,8 billion, respectively.
Total exports ended at NOK 443 billion in the third quarter of 2021, which is NOK 88 billion higher than in to the previous quarter and NOK 187 billion more than in the same quarter in 2020. Beside oil and natural gas, refined petroleum products, metals and electricity contributed to the growth in export income. Exports of services are registered at about NOK 93 billion in the third quarter of 2021. Increased ocean transport counts for much of the growth in export income, but also the aforementioned travel exports.
Total imports in the third quarter of 2021 increased by more than NOK 20 billion measured against the previous quarter and registered at about NOK 313 billion. The sharp growth was primarily driven by a rise in imports of travel, but imports of petroleum services and imports related to ocean transport contributed.
For more information about exports and imports, including price and volume considerations and seasonal adjustments, please see the quarterly national accounts.
The balance of income and current transfers
The balance of income and current transfers also includes financial income related to direct investments abroad and expenses related to foreigners' direct investments in Norway. Parts of these incomes and expenses are observable, such as dividends received from abroad and dividends paid abroad. However, parts of the income and expenses are not directly observable, which we call reinvested earnings, i.e. retained "income" that is plowed back into the company's equity. This relationship exists both ways, i.e. also for foreigners' direct investments in Norway. There are often very large revisions associated with so-called reinvested earnings, and it is debatable whether these items should be included in the balance of income and current transfers. In recent years, net income from reinvested earnings has shown large fluctuations around a trend close to zero. In the presentation of key figures for the current account of the external accounts (Balance of Payments) in this report, we have chosen to exclude reinvested earnings. This applies to the variables balance of income and current transfers, current account balance, and net lending for the country. When we discuss these figures in the future, it will therefore be about these balance items excluding reinvested earnings. In the main table of statistics on the statistics page, we have nevertheless designed memo items that include net reinvested earnings.
Preliminary calculations of the balance of income and current transfers amounted to NOK 28 billion in the third quarter of 2021 when net reinvested earnings is excluded. This is NOK 7 billion lower than the same period in 2020. The current account balance ended at NOK 158 billion, excluding net reinvested earnings, which is NOK 43 billion higher than in the previous quarter. This is Norway’s highest current account balance ever for one single quarter. The latter quarters have been characterized by the fluctuating prices for crude oil and natural gas, which is illustrated by the fact that second quarter 2020 showed the lowest current account balance in history for Norway.
The financial account
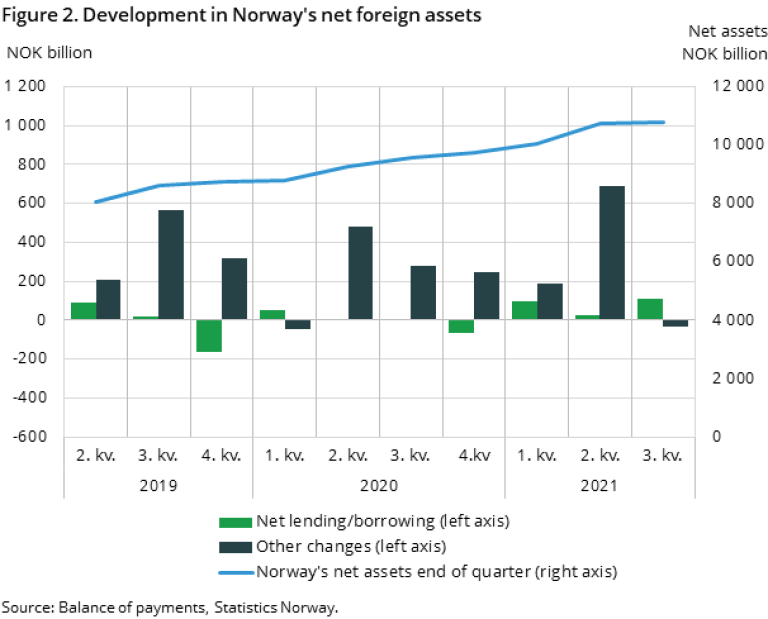
Norway’s net foreign assets were equal to NOK 10 794 billion by the end of the 3rd quarter of 2021. This is an increase of 61 billion NOK since the end of the previous quarter.
The growth in Norway’s net foreign assets was the weakest since the 1st quarter of 2020. As we can see from figure 2 below, the weak growth can be explained by negative other changes, which consists of market price changes and exchange rate changes. Even though other changes were net negative for the quarter, there was still a positive change in Norway’s net foreign assets due to positive net lending, which had a larger effect than the effect of other changes.
Other changes
The growth in the global stock markets as seen in previous quarters, did not prevail and the financial account showed negative market price changes in the 3rd quarter of 2021. On the other hand, the Norwegian krone depreciated this quarter resulting in positive exchange rate changes. Usually, market price changes have a stronger effect on Norway’s net foreign assets than exchange rate changes. This is also the case for the 3rd quarter of 2021, where negative market price changes and positive exchange rate changes combined result in a negative effect on net foreign assets for Norway.
Financial transactions
Net lending for the 3rd quarter of 2021 was NOK 107 billion, and as we can see from figure 2 it was an increase from the previous quarter. Financial institutions such as deposit-taking corporations and insurance companies were sectors that contributed to this growth by both increasing their foreign assets and reducing their foreign debt.
Good data capture and quality
Many parts of the economic statistics have been affected by the corona pandemic, and the uncertainty is unusually high. However, the international accounts seem to have been less affected. Providers of primary data have been able to collect the necessary information according to the planned schedule, and the data quality seems satisfactory. The uncertainty about the foreign accounts for the third quarter of 2021 does therefore not seem to be greater than usual.
The financial account has been revised back to the first quarter of 2019. Current account: Normally, the Balance of Payments is revised back to the base year after the base year change in the national accounts. The reason is, of course, that the figures must be reconciled in the different accounts in order to maintain internal consistency. This makes it easier for users to see the full picture, and it also generates less errors in reported figures to international organizations like Eurostat and IMF, to whom Norway is obliged to report. In 2021, the base year in the National Accounts Supply and Use Tables changes from 2018 to 2019. This takes place in the third-quarter publication, and we have therefore chosen to do the same in the international accounts. Consequently, the figures for 2019 and 2020 in addition to the first and second quarters of 2021, are revised in this publication. Revision of 2019 and 2020: 2019 has been subject to revisions in connection with the publication of the final 2019 supply and use tables in the national accounts. The 2020 figures have been recalculated as a result of new information in 2019, but also on the basis of new information from several data sources. This applies to both imports and exports of goods and services that are included in the real accounts, and it applies to salaries and investment income and other transfers that are included in the national accounts' sector accounts. Export and import Exports have been reduced by a total of about NOK 4 billion in 2019. It is mainly services that have been revised, and especially financial intermediates indirectly measured (FISIM). These are largely the same elements we have in the revision of the current 2020 figures. Exports of goods have only undergone minor revisions, while on the service side it is again FISIM that causes a downward adjustment. The total net downward adjustment of exports for 2020 is NOK 10 billion. Imports for 2019 have been adjusted upwards by NOK 600 million. Services have been revised more than goods. For 2020, there is an upward adjustment of imports of about NOK 3 billion. Here, especially figures services contribute, and financial and insurance services most significantly. The balance of income and current transfers with net reinvested earnings excluded, has been adjusted upwards by about NOK 16 billion for 2019 compared with published figures. For 2020 the same account item has been revised downward NOK 14 billion. Higher estimated dividends on portfolio investments to abroad made a large contribution to this by a downward revision of just about NOK 32 billion. Revision of the first and second quarters 2021: Total exports were revised down and up by NOK 9.5 billion and NOK 4.8 billion, respectively in the first and second quarters of 2021. This is primarily driven by new price figures natural gas. However, services have also been revised down by about NOK 3 billion both quarters. Here, it is the revision of FISIM that were made in the base year that are reflected in the preliminary figures. Imports are revised up NOK 600 million in the first quarter and up NOK 3.6 billion in the second quarter. The revisions are distributed more evenly between goods and services.