Content
Published:
This is an archived release.
Higher oil and gas prices boost trade surplus
The trade surplus in February ended at NOK 23.5 billion and more than doubled against February last year. This was mainly driven by oil and gas prices.
| NOK Million | Change in per cent | NOK Million - so far this year | Change in per cent - so far this year | ||
|---|---|---|---|---|---|
| February 2017 | January 2017 - February 2017 | February 2016 - February 2017 | February 2017 | February 2016 - February 2017 | |
| 1The figures are marked with the symbol *. This is Statistics Norways standard symbol for indicating preliminary figures. | |||||
| 2Due to the data collection method, the preliminary monthly figures published for ships and oil platforms are often incomplete. In retrospect, therefore, the trade in these goods could in some cases lead to major corrections in the figures. Please see tables 1-3 for the impact these figures have on the external trade. | |||||
| Exports | 71 244 | -5.5 | 18.0 | 146 668 | 21.2 |
| Crude oil | 18 600 | -15.0 | 51.9 | 40 483 | 66.7 |
| Natural gas | 19 067 | -1.8 | 21.8 | 38 480 | 19.1 |
| Natural gas condensates | 590 | 35.9 | 633.8 | 1 025 | 58.2 |
| Ships and oil platforms2 | 1 077 | -39.7 | 728.5 | 2 862 | 364.6 |
| Mainland exports | 31 909 | 0.0 | -1.2 | 63 818 | 1.1 |
| Fish | 7 524 | 1.7 | 8.9 | 14 919 | 10.9 |
| Imports | 47 704 | -2.2 | -3.7 | 96 468 | 3.5 |
| Ships and oil platforms2 | 400 | -30.9 | 3.9 | 980 | 56.3 |
| The trade balance | 23 539 | -11.7 | 116.9 | 50 200 | 80.8 |
| The mainland trade balance | -15 395 | 5.4 | 8.8 | -31 670 | -7.5 |
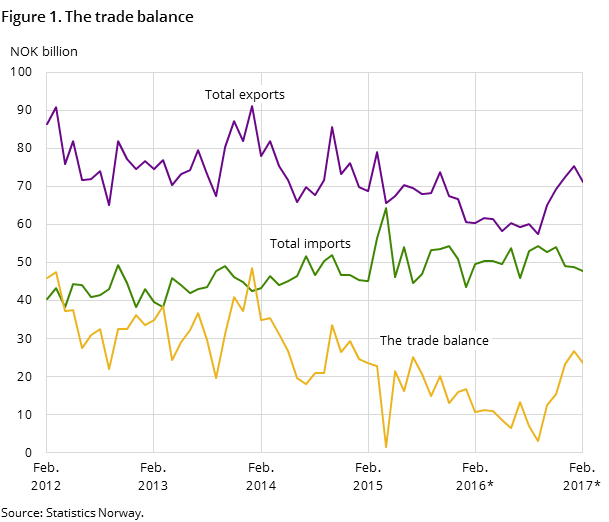
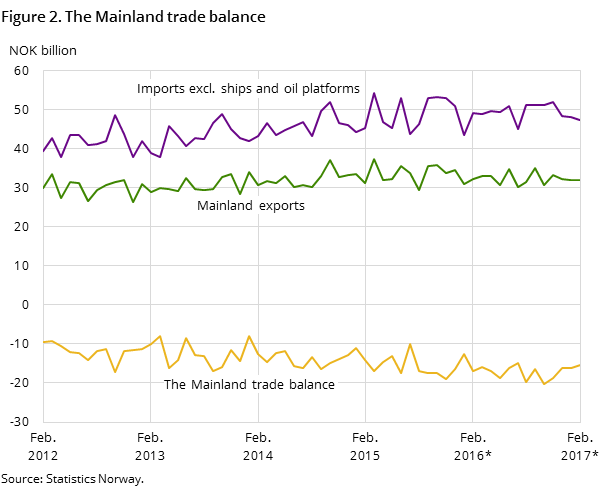
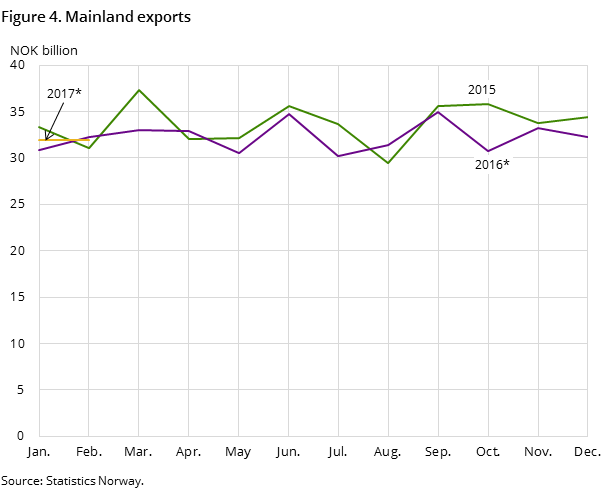
Total exports of goods amounted to NOK 71.2 billion in February and increased by 18.0 per cent from February last year. Mainland exports went down by 1.2 per cent to NOK 31.9 billion. In the same period import values fell by 3.7 per cent and ended at NOK 47.7 billion. Overall, the trade balance amounted to NOK 23.5 billion in February, with a twelve month change equal to 116.9 per cent.
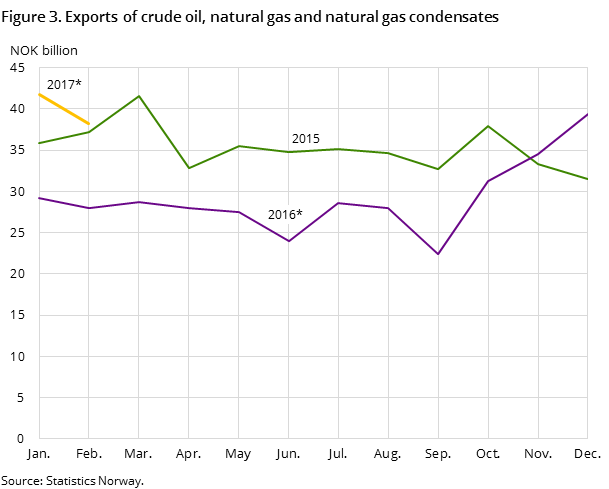
Oil and gas exports near NOK 40 billion
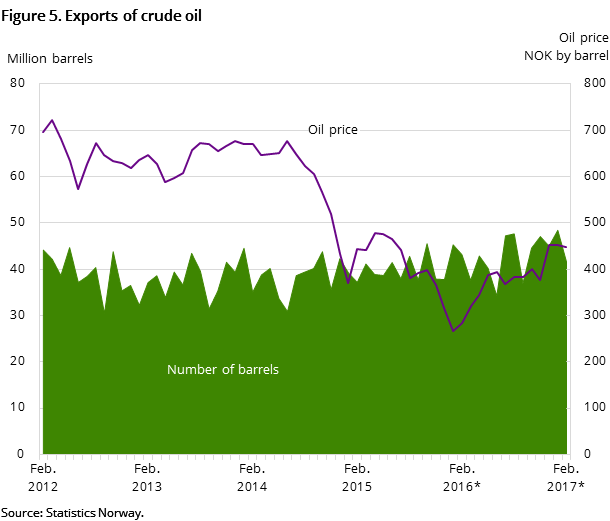
Oil exports ended at NOK 18.6 billion in February, which was up by 51.9 per cent from the same period last year. The increase is due to an upward trend in oil prices since January 2016. Oil prices decreased somewhat from January this year, but went up by 57.7 per cent over the last twelve months, from NOK 284 to 447 per barrel. In the same period, the export volume went back by 3.6 per cent to 41.6 million barrels in February.
A major rise was also seen in export values of natural gas, ending at NOK 19.1 billion in February - up 21.8 per cent from February last year. The price of natural gas in gaseous state has increased by 28.9 per cent the last twelve months, while the export volume was 9.6 billion standard cubic meters - a decrease of 3.6 per cent.
Other significant twelve-month changes
- Exports of refined mineral products amounted to NOK 2.8 billion in February and went up by 36.2 per cent compared to February last year, due to higher prices.
- An increase was also seen in prices of liquefied propane and butane, with export values increasing by 74.9 per cent to NOK 1.7 billion.
- Exports of industrial machines totaled NOK 2.7 billion and fell by 30.8 per cent against February last year.
- Imports of passenger cars ended at NOK 3.3 billion, down by 14.2 per cent from February last year. The number of cars went back 15.9 per cent.
- Imports of goods used in wind power generation was high in February. Import values of rotating electric plants ended at NOK 1.2 billion and more than quintupled against February last year.
Contact
-
Information services external trade
E-mail: utenrikshandel@ssb.no
-
Nina Rolsdorph
E-mail: nina.rolsdorph@ssb.no
tel.: (+47) 41 51 63 78
-
Jan Olav Rørhus
E-mail: jan.rorhus@ssb.no
tel.: (+47) 40 33 92 37
