Content
Published:
This is an archived release.
Steady growth in the trade surplus
The trade surplus was NOK 25.0 billion in January 2017, an increase of 48.1 per cent from the same month last year. There was a strong growth in exports of oil of 81.8 per cent, while the export of natural gas was up 16.5 per cent. Imports of goods came to NOK 48.8 billion.
| NOK Million | Change in per cent | ||
|---|---|---|---|
| January 2017 | December 2016 - January 2017 | January 2016 - January 2017 | |
| 1The figures are marked with the symbol *. This is Statistics Norways standard symbol for indicating preliminary figures. | |||
| 2Due to the data collection method, the preliminary monthly figures published for ships and oil platforms are often incomplete. In retrospect, therefore, the trade in these goods could in some cases lead to major corrections in the figures. Please see tables 2-4 for the impact these figures have on the external trade. | |||
| Exports | 73 816 | 1.8 | 21.9 |
| Crude oil | 21 882 | 7.5 | 81.8 |
| Natural gas | 19 413 | 2.6 | 16.5 |
| Natural gas condensates | 125 | -66.3 | 10.4 |
| Ships and oil platforms2 | 219 | -74.1 | -54.9 |
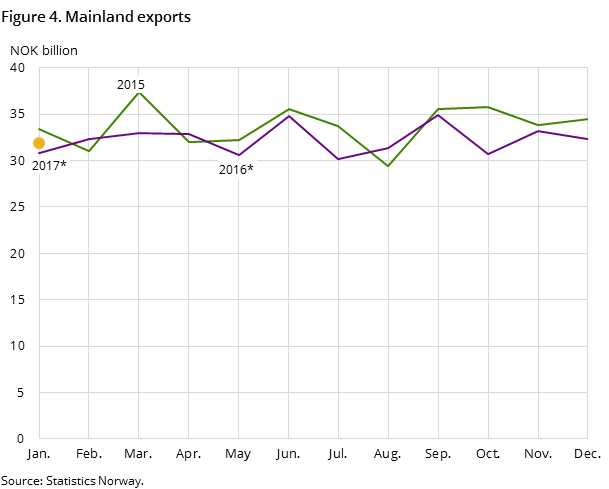
| Mainland exports | 31 867 | -1.2 | 3.4 |
| Fish | 7 409 | 13.2 | 13.2 |
| Imports | 48 771 | -0.8 | 11.7 |
| Imports of ships and oil platforms | 579 | -25.9 | 140.2 |
| The trade balance | 25 046 | 7.3 | 48.1 |
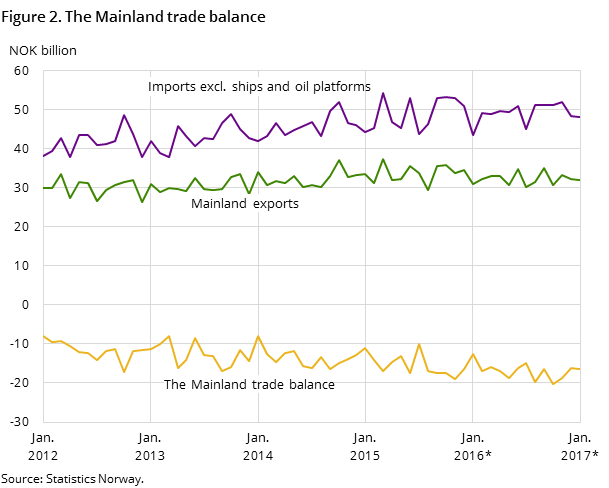
| The mainland trade balance | -16 325 | 1.2 | 29.6 |
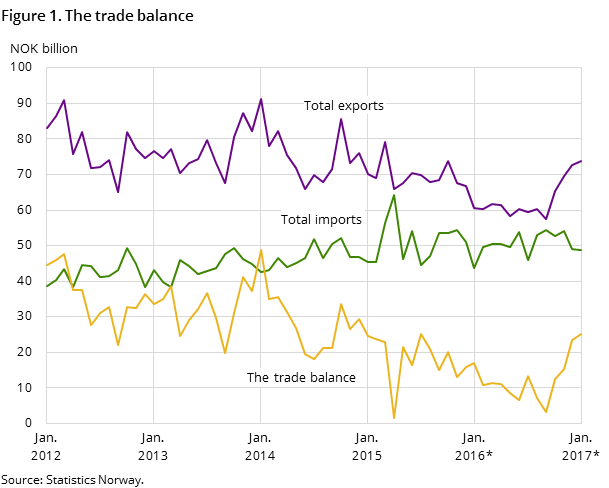
After two years of a steady fall in the trade surplus since the autumn of 2014, there has been an increase every month since September 2016.
Exports of goods grew by 21.9 per cent and imports of goods were up 11.7 per cent. In the same period, mainland exports increased by 3.4 per cent, reaching 31.9 billion.
Another month with oil exports above NOK 20 billion
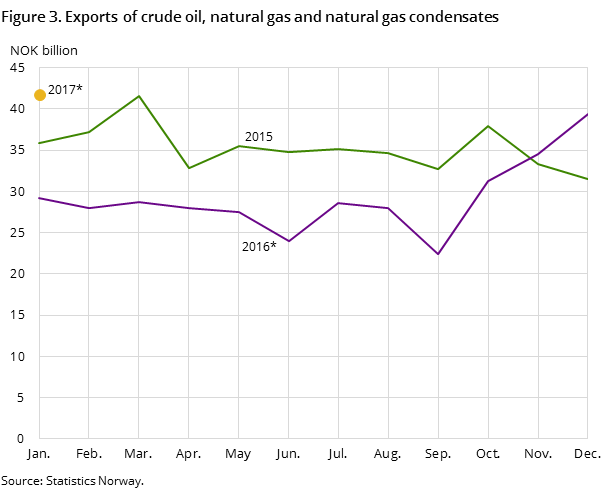
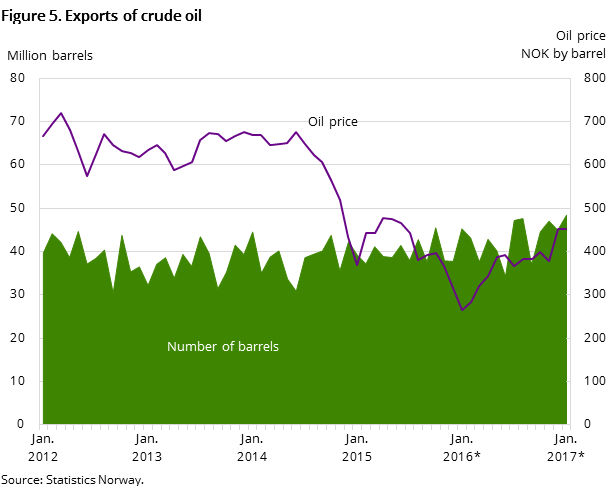
¬In January 2017, the export value of crude oil was NOK 21.9 billion. This is NOK 9.8 billion more than in January 2016. The main reason was an increase in crude oil prices of 70 per cent, from NOK 266 per barrel in January 2016 to NOK 452 in January 2017. The export volume was 48.4 million barrels in January 2017, an increase of 6.9 per cent compared to January 2016. The number of barrels exported in a single month is the highest seen since 2011.
¬The export value of natural gas in January came to NOK 19.4 billion, an increase of 16.5 per cent compared to the corresponding period in 2016. The export volume increased by 4.2 per cent, ending at 11.0 billion standard cubic metres. In addition, prices showed a slight increase.
Other significant twelve-month changes
- Exports of fresh salmon amounted to NOK 4.1 billion in January 2017, an increase of 13.2 per cent due to higher prices. The price of salmon was all time high, at NOK 72 per kilogram.
- The export of metals was high, totaling NOK 5.1 billion, a growth of 22.6 per cent compared to January 2016. Exports of aluminium alloys was up NOK 263.9 million, due to both higher prices and volumes.
- Imports of passenger cars ended at NOK 3.2 billion, up 35.7 per cent from January 2016. Electrical cars and hybrid cars made up about 40 per cent of both the value and number of cars.
Contact
-
Information services external trade
E-mail: utenrikshandel@ssb.no
-
Nina Rolsdorph
E-mail: nina.rolsdorph@ssb.no
tel.: (+47) 41 51 63 78
-
Jan Olav Rørhus
E-mail: jan.rorhus@ssb.no
tel.: (+47) 40 33 92 37
