Content
Published:
This is an archived release.
Higher imports
Goods at a total of NOK 52.2 billion were imported in August. This is almost 11 percent more than 12 months ago. Exports however declined by over 13 per cent to NOK 59 billion. All in all this contributed to a continued low trade surplus of NOK 6.8 billion.
| NOK Million | Change in per cent | NOK Million - so far this year | Change in per cent - so far this year | ||
|---|---|---|---|---|---|
| August 2016 | July 2016 - August 2016 | August 2015 - August 2016 | August 2016 | August 2015 - August 2016 | |
| 1The figures are marked with the symbol *. This is Statistics Norways standard symbol for indicating preliminary figures. | |||||
| 2Due to the data collection method, the preliminary monthly figures published for ships and oil platforms are often incomplete. In retrospect, therefore, the trade in these goods could in some cases lead to major corrections in the figures. Please see tables 2-4 for the impact these figures have on the external trade. | |||||
| Imports | 52 244 | 13.8 | 10.9 | 394 935 | -2.1 |
| Ships and oil platforms2 | 1 318 | 67.3 | 63.1 | 8 277 | -66.2 |
| Exports | 59 006 | -0.9 | -13.1 | 475 702 | -15.0 |
| Crude oil | 16 264 | -1.3 | -0.3 | 112 369 | -18.9 |
| Natural gas | 10 238 | -14.7 | -42.2 | 100 820 | -30.5 |
| Natural gas condensates | 144 | -66.9 | -78.2 | 2 597 | -32.8 |
| Ships and oil platforms2 | 790 | 24.0 | -79.1 | 4 416 | -41.3 |
| Mainland exports | 31 571 | 5.2 | 7.2 | 255 500 | -3.5 |
| The trade balance | 6 763 | -50.5 | -67.5 | 80 767 | -48.3 |
| The mainland trade balance | -19 355 | -28.1 | -14.8 | -131 158 | -14.9 |
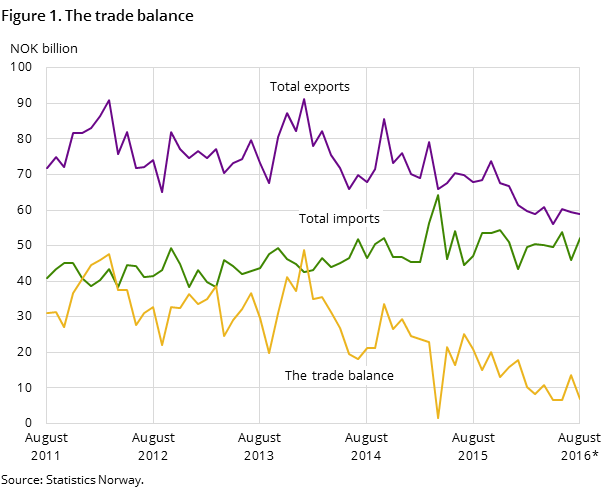
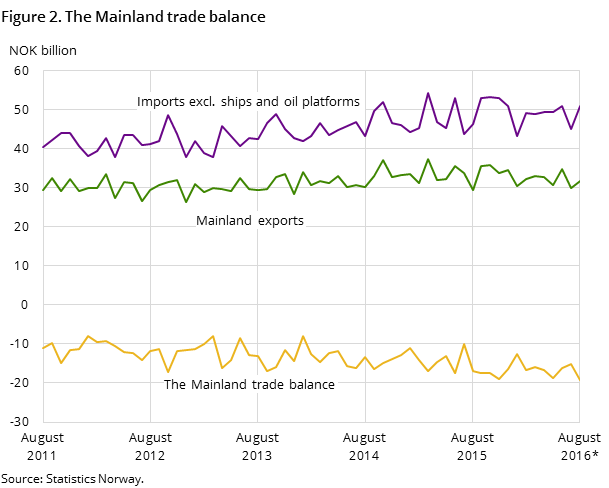
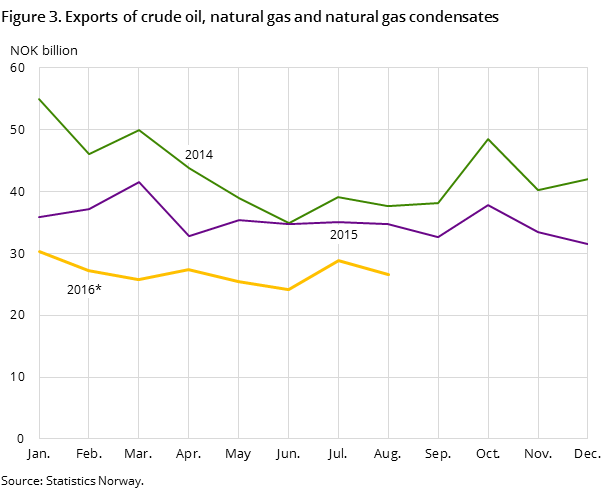
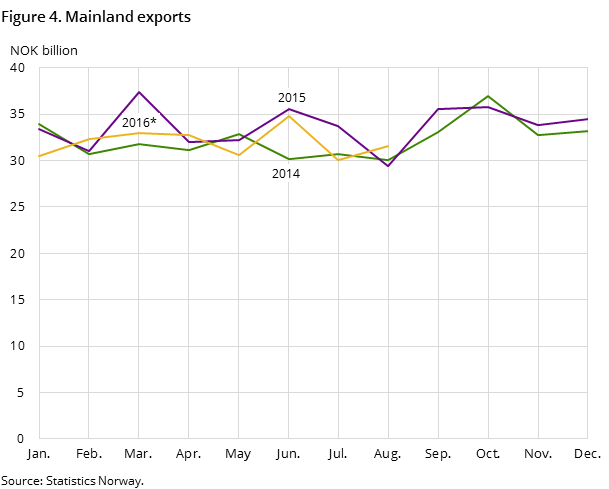
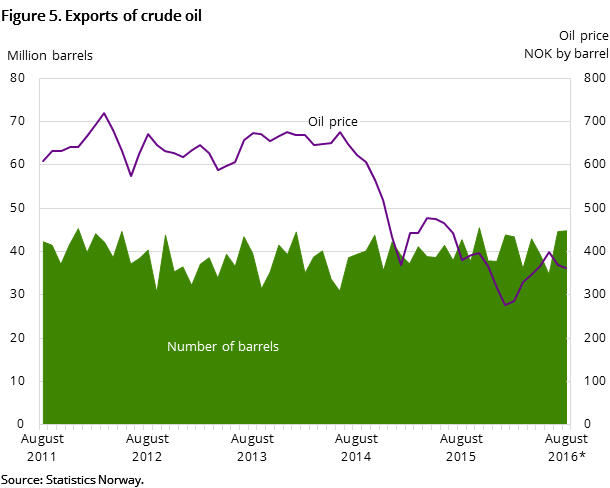
The trade surplus in August totaled NOK 6.8 billion, which is 67.5 percent lower than the same month in 2015. The main reason for the decline is high imports and low exports of natural gas. Export of crude oil is only marginally lower than last year. Mainland exports rose 7.2 percent to NOK 31.6 billion, and thereby contributed in isolation to draw trade surplus up.
Lower exports of natural gas
Exports of natural gas amounted to NOK 10.2 billion in August. This is a drop of 42.2 percent from the same month the previous year when exports amounted to NOK 17.7 billion. A total of 7.5 billion standard cubic meters of gas in gaseous form were shipped abroad, which is 16.9 percent lower compared with August 2015. The reason for the low exports of natural gas was due to maintenance.
Crude oil exports in August totaled NOK 16.3 billion, which are only NOK 57 million less than the previous year. A total of 44.8 million barrels of crude oil were shipped abroad - an increase of 4.8 percent from August 2015. The average price is estimated to NOK 363 per barrel, which is NOK 19 lower than last year.
Increased value of mainland exports
In August, exports of mainland goods amounted to NOK 31.6 billion - an increase of 7.2 percent compared with August 2015.
Fish exports increased by 32.9 percent from August 2015, and amounted to NOK 6.9 billion. The increase is largely attributed to higher salmon prices this year. Fresh whole salmon at a total of NOK 4.2 billion were shipped abroad in August, compared to NOK 2.9 billion last year.
The exports within the main commodity group machinery and transport equipment fell the most in August - down 17.6 per cent to NOK 7.7 billion. The decrease is mainly due to high exports in the sub group other transport equipment in 2015. This group dropped by 60 percent and amounted to NOK 1.6 billion. The subgroup electrical machinery rose by almost 150 percent to NOK 2.1 billion. The large increase here is due to shipments to several major projects this month.
Increased imports
Imports in August rose by 10.9 per cent and amounted to NOK 52.2 billion. Only two out of ten main commodity groups had declining imports – in addition the decline in both of these groups were below NOK 100 million, which is relatively modest.
Imports of machinery and transport equipment, with a growth of 18.4 percent, were the main group that increased the most. The subgroups other transport equipment and road vehicles stood for the bulk of the increase. These groups rose by respectively NOK 2 billion and NOK 1.1 billion - to NOK 3.9 billion and NOK 5.1 billion.
Only the commodity groups chemical products and fuels decreased this month. These groups went down by 1.7 percent and 4.1 percent, ending at respectively NOK 5.3 and NOK 2 billion.
Contact
-
Information services external trade
E-mail: utenrikshandel@ssb.no
-
Nina Rolsdorph
E-mail: nina.rolsdorph@ssb.no
tel.: (+47) 41 51 63 78
-
Jan Olav Rørhus
E-mail: jan.rorhus@ssb.no
tel.: (+47) 40 33 92 37
