Content
Published:
This is an archived release.
Decline in exports
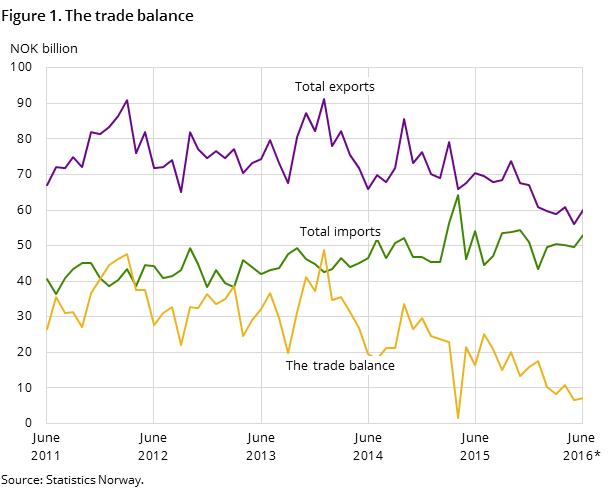
Lower oil and gasprices, maintenance and reduced oil production pulled down export value in June. Exports of goods ended at NOK 60 billion and went down by 14.9 per cent from last year. Comparing the first six months, export value has dropped 15.5 per cent.
| NOK Million | Change in per cent | NOK Million - so far this year | Change in per cent - so far this year | ||
|---|---|---|---|---|---|
| June 2016 | May 2016 - June 2016 | June 2015 - June 2016 | June 2016 | June 2015 - June 2016 | |
| 1The figures are marked with the symbol *. This is Statistics Norways standard symbol for indicating preliminary figures. | |||||
| 2Due to the data collection method, the preliminary monthly figures published for ships and oil platforms are often incomplete. In retrospect, therefore, the trade in these goods could in some cases lead to major corrections in the figures. Please see tables 2-4 for the impact these figures have on the external trade. | |||||
| Imports | 53 015 | 6.9 | -2.0 | 296 033 | -5.0 |
| Ships and oil platforms2 | 2 011 | 534.4 | 89.7 | 5 351 | -76.6 |
| Exports | 59 986 | 6.8 | -14.9 | 356 386 | -15.5 |
| Crude oil | 13 835 | -4.2 | -28.3 | 79 629 | -24.5 |
| Natural gas | 9 685 | -11.4 | -35.5 | 78 579 | -28.0 |
| Natural gas condensates | 557 | 353.5 | 28.7 | 2 020 | -33.9 |
| Ships and oil platforms2 | 1 045 | 763.6 | 601.3 | 2 098 | -24.5 |
| Mainland exports | 34 865 | 14.0 | -2.0 | 194 061 | -3.7 |
| The trade balance | 6 971 | 5.4 | -57.5 | 60 353 | -45.3 |
| The mainland trade balance | -16 140 | 13.6 | 7.4 | -96 622 | -10.7 |
* = preliminary figures
Imports totalled NOK 53 billion and fell 2.0 per cent from June last year. Contributing factor is last year’s import of oil platform constructions at a value of NOK 1.9 billion. In the first six months of 2016, total import value declined by 5.0 per cent compared to last year.
So far this year, trade surplus reached NOK 60.4 billion, which is down 45.3 per cent from the same period last year.
Lower oil exports due to maintenance
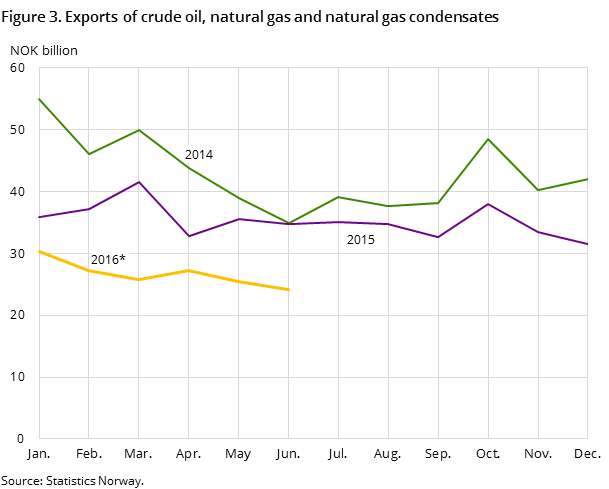
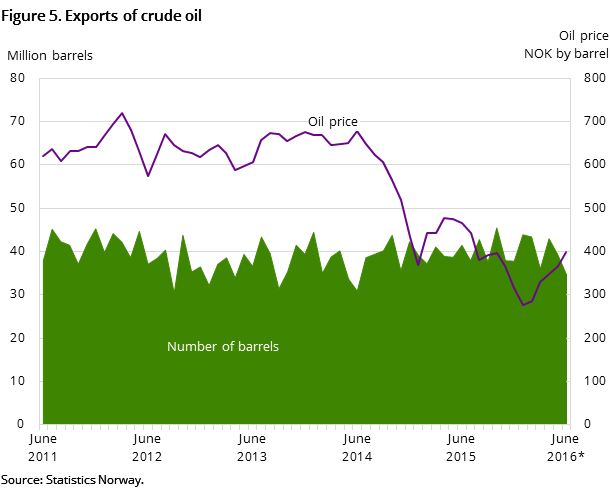
Exports of crude oil ended at NOK 13.8 billion, and fell 28.3 per cent from June last year.
This was due to a combination of reduced export volumes and lower prices. Scheduled maintenance reduced oil production in June and export volumes were at their lowest since June 2014.
34.7 million barrels where exported, this was down 16.2 per cent from last year. Despite ricing oil prices, prices in June were NOK 67 lower than 12 months earlier.
Natural gas exports also dropped significantly, ending at NOK 9.7 billion and down 35.5 per cent against June last year. The decline was caused by lower prices. Exports of natural gas in gaseous state where 7.6 billion standard cubic metres and at the same level as last year.
Reduced values from mainland exports
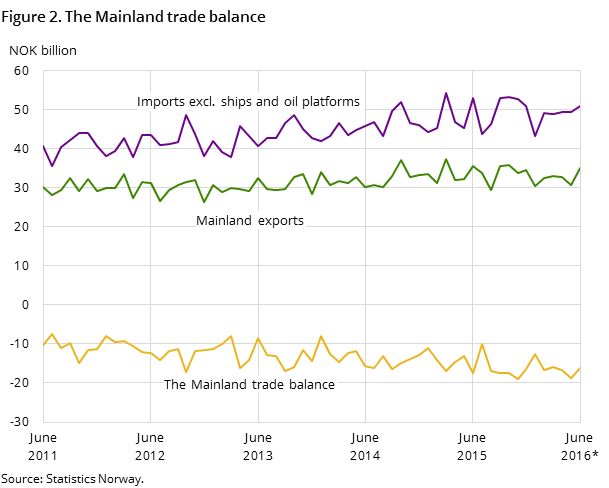
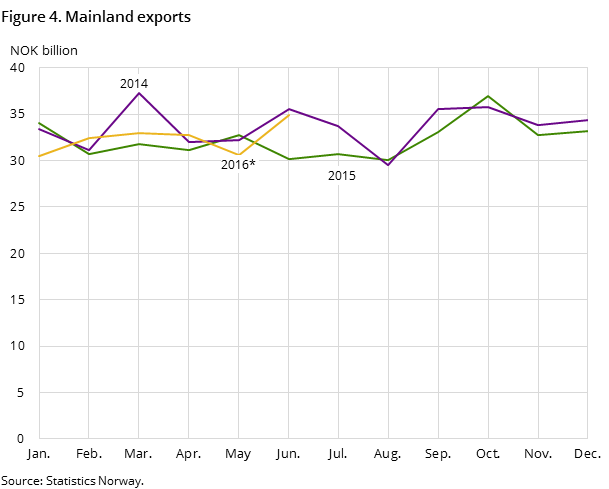
Mainland exports amounted to NOK 34.9 billion in June, higher than previous months, but down 2.0 per cent compared to the same period last year. Except from foods, where ricing fish prices pulled export values, a decline was seen in most of the main commodity groups.
Exports of refined petroleum products ended at NOK 2.6 billion and dropped 27.8 per cent against June last year. While non-ferrous metals fell by 16.4 per cent to NOK 3.4 billion. A large decrease was also seen in electrical machinery and apparatus that went down by 27.3 per cent reaching NOK 1.1 billion in June.
Record high prices for salmon
Export value of fish continued to rise. In June, exports of fish came to NOK 6.9 billion, an increase of 23.1 per cent compared to June last year. The main cause is prices of fresh whole salmon that rose 60.0 per cent the last twelve months, and reached NOK 65 per kilo in June.
Decline in imports of manufactures of metals
The value of imports, excluding ships and oil platform, decreased by 3.8 per cent compared to June last year, reaching NOK 51 billion.
Imports of manufactures of metals dropped 45.7 per cent against June last year ending at NOK 2.4 billion. This was due to last year’s imports of oil platform constructions at a value of NOK 1.9 billion
There was also a large decrease in refined petroleum products, which nearly halved from June last year, and came to NOK 980 million, while imports of metalliferous ores and metal scrap fell by 35.5 per cent to NOK 1.3 billion.
Contact
-
Information services external trade
E-mail: utenrikshandel@ssb.no
-
Nina Rolsdorph
E-mail: nina.rolsdorph@ssb.no
tel.: (+47) 41 51 63 78
-
Jan Olav Rørhus
E-mail: jan.rorhus@ssb.no
tel.: (+47) 40 33 92 37
