Content
Published:
This is an archived release.
Exports fell less in April
Exports of goods went down by 7.9 per cent from April last year. This decline was lower than in previous months. Oil and gas exports have increased in volume, but a drop in prices has pulled down the export value. Fish exports pushed up mainland exports, which increased by 2.7 per cent.
| NOK Million | Change in per cent | NOK Million - so far this year | Change in per cent - so far this year | ||
|---|---|---|---|---|---|
| April 2016 | March 2016 - April 2016 | April 2015 - April 2016 | April 2016 | April 2015 - April 2016 | |
| 1The figures are marked with the symbol *. This is Statistics Norways standard symbol for indicating preliminary figures. | |||||
| 2Due to the data collection method, the preliminary monthly figures published for ships and oil platforms are often incomplete. In retrospect, therefore, the trade in these goods could in some cases lead to major corrections in the figures. Please see tables 2-4 for the impact these figures have on the external trade. | |||||
| Imports | 50 020 | -1.0 | -22.2 | 193 449 | -8.5 |
| Ships and oil platforms2 | 578 | -66.6 | -96.7 | 2 931 | -86.0 |
| Exports | 60 622 | 3.2 | -7.9 | 240 043 | -15.4 |
| Crude oil | 14 939 | 25.3 | -19.7 | 51 359 | -24.2 |
| Natural gas | 12 068 | -10.7 | -14.4 | 57 961 | -25.9 |
| Natural gas condensates | 0 | . | -100.0 | 1 340 | -8.2 |
| Ships and oil platforms2 | 404 | 608.8 | -57.4 | 1 450 | -44.3 |
| Mainland exports | 32 901 | 0.1 | 2.7 | 127 932 | -4.4 |
| The trade balance | 10 602 | 29.1 | 619.3 | 46 594 | -35.7 |
| The mainland trade balance | -16 541 | -3.8 | -12.7 | -62 585 | -10.4 |
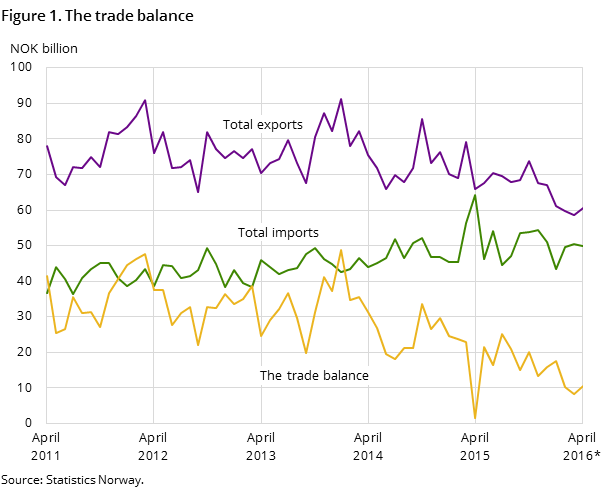
Exports in April amounted to NOK 60.6 billion, which was a fall of 7.9 per cent from April last year. In the first four months of 2016, exports of goods decreased by 15.4 per cent compared to 2015.
Imports totalled NOK 50 billion and dropped 22.2 per cent from April last year. This reduction reflects last year’s import of an oil platform, which gave a historically high import value for a single month.
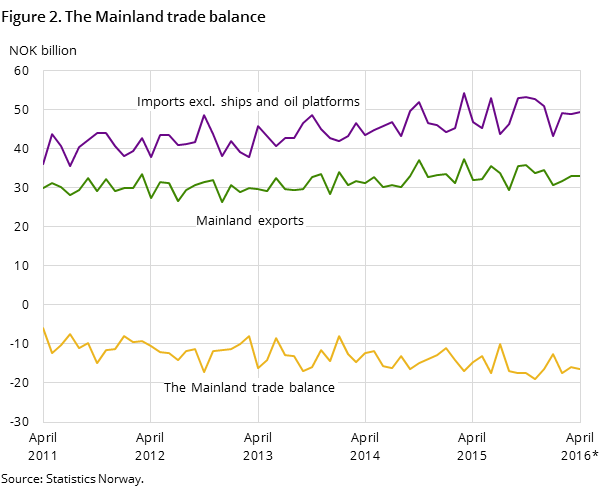
If trade with ships and oil platforms are excluded, imports increased by 5.9 per cent in April. So far this year imports have declined by 8.5 per cent compared to last year.
Between January and the end of April 2016, the trade balance reached NOK 46.6 billion, which is down by 35.7 per cent from the same period in 2015.
Seasonally-adjusted figures
Monthly figures are affected by Easter falling in April last year. Seasonally-adjusted figures on exports, excluding ships and oil platforms, fell by 12.4 per cent compared to April 2015. Imports excluding ships and oil platforms declined by 3.6 per cent.
Lower income from crude oil and natural gas
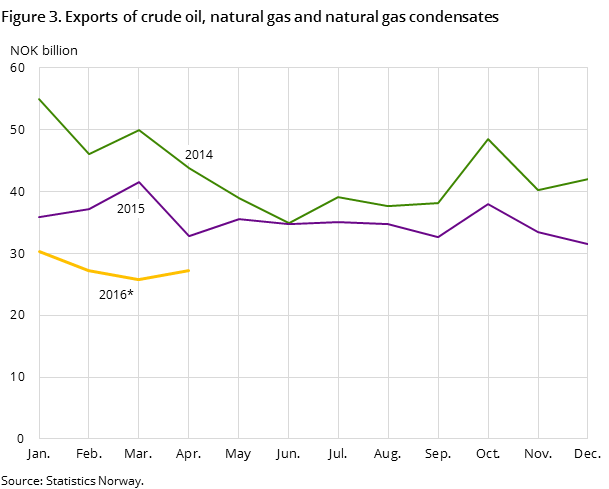
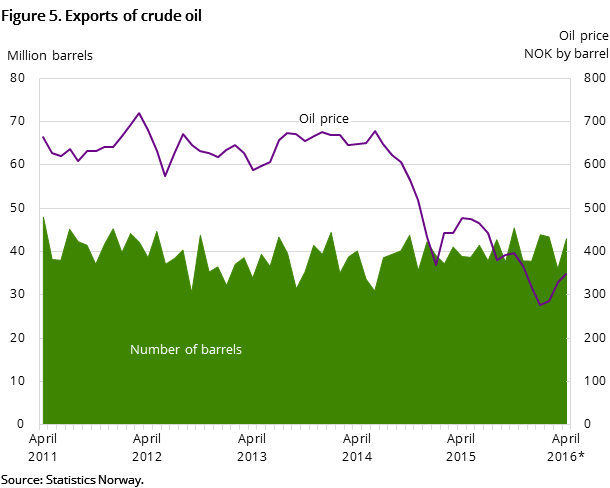
Exports of crude oil ended at NOK 14.9 billion in April, which was a fall of 19.7 per cent from April last year. Since January, when oil prices where especially low at NOK 276 per barrel, the price has increased almost 26 per cent, reaching NOK 348 in April. Compared to April last year, prices are still low, and down by 27.3 per cent. In the same period, export volumes increased by 10.6 per cent to 43 million barrels.
Natural gas prices have also dropped significantly. Natural gas exports totalled NOK 12.1 billion in April, which was a fall of 14.4 per cent from April last year. In the last twelve months, prices have dropped 37.8 per cent. A total of 9.8 billion standard cubic metres were exported in April, which was an increase of 36.3 per cent from April last year.
Increase in export values of fish
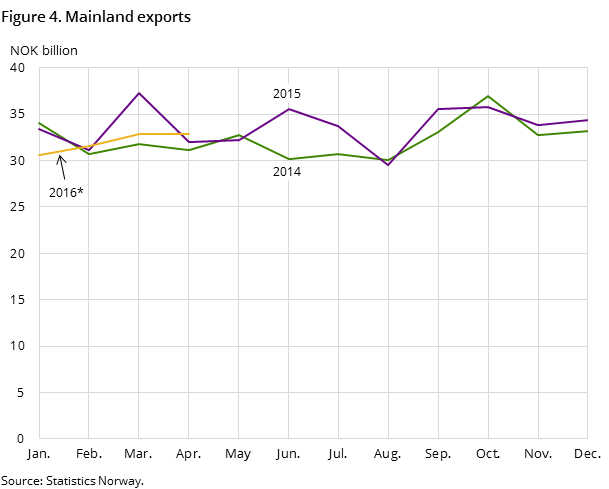
Mainland exports amounted to NOK 32.9 billion in April, increasing 2.7 per cent compared to the same period last year.
Fish exports rose by 37.3 per cent from April last year, reaching NOK 7.2 billion. One contributing factor is high salmon prices. Prices of fresh whole salmon have increased more than 43 per cent in the last twelve months, and were NOK 57 per kilo in April. Export value of fresh whole salmon rose by 39.0 per cent, ending at NOK 3.8 billion, while volumes fell by 2.9 per cent. A large increase was also seen in organic chemical products, which went up 32.1 per cent to NOK 1.3 billion.
In the other direction, exports of industrial machines fell 19.1 per cent from April last year, to NOK 3.6 billion. Exports of refined mineral oil products dropped 23.4 per cent to NOK 2.3 billion, while exports of non-ferrous metals fell by 10.2 per cent to NOK 3.5 billion.
Growth in imports of machinery and transport equipment
The value of imports, excluding ships and oil platforms, increased by 5.9 per cent compared to April last year, reaching NOK 49.4 billion.
If we disregard the import of an oil platform in April 2015, the largest increase was for machinery and transport equipment. Imports of road vehicles went up by 16.1 per cent, totalling NOK 6.1 billion, while the sub-group industrial machinery went up 10.7 per cent to NOK 6.4 billion. There was also an increase in the main commodity groups chemicals and related products as well as manufactured goods, which rose by 10.8 per cent and 11.9 per cent respectively, ending at NOK 5.5 billion and NOK 7.6 billion.
On the other hand, there was a significant fall in imports of metalliferous ores and metal scrap, which fell 41.4 per cent compared to April last year, reaching NOK 1.4 billion. There was also a drop in imports of petroleum products, under the main commodity group mineral fuels, which came to NOK 1.3 billion – a decrease of 30.1 per cent compared to April last year.
Contact
-
Information services external trade
E-mail: utenrikshandel@ssb.no
-
Nina Rolsdorph
E-mail: nina.rolsdorph@ssb.no
tel.: (+47) 41 51 63 78
-
Jan Olav Rørhus
E-mail: jan.rorhus@ssb.no
tel.: (+47) 40 33 92 37
