Content
Published:
This is an archived release.
Trade surplus down
Imports of goods came to NOK 50.9 billion in December, while exports amounted to NOK 69.1 billion. This resulted in a trade surplus of NOK 18.1 billion, down NOK 11.2 billion from the same month in 2014. Reduced profits from shelf goods explain the decline, while growth in mainland exports curbed the fall.
| NOK Million | Change in per cent | NOK Million - so far this year | Change in per cent - so far this year | ||
|---|---|---|---|---|---|
| December 2015 | November 2015 - December 2015 | December 2014 - December 2015 | December 2015 | December 2014 - December 2015 | |
| 1The figures are marked with the symbol *. This is Statistics Norways standard symbol for indicating preliminary figures. | |||||
| 2Due to the data collection method, the preliminary monthly figures published for ships and oil platforms are often incomplete. In retrospect, therefore, the trade in these goods could in some cases lead to major corrections in the figures. Please see tables 2-4 for the impact these figures have on the external trade. | |||||
| Imports | 50 945 | -3.1 | 9.0 | 614 091 | 9.5 |
| Ships and oil platforms2 | 116 | -88.1 | -80.3 | 26 416 | 143.7 |
| Exports | 69 058 | 1.5 | -9.1 | 847 744 | -6.7 |
| Crude oil | 13 267 | -5.3 | -27.5 | 199 833 | -29.3 |
| Natural gas | 19 839 | 2.5 | -14.3 | 227 906 | 1.9 |
| Natural gas condensates | 480 | 5.5 | -3.8 | 5 157 | -36.3 |
| Ships and oil platforms2 | 747 | 347.3 | -22.3 | 8 608 | 17.1 |
| Mainland exports | 35 093 | 3.1 | 6.3 | 406 239 | 5.1 |
| The trade balance | 18 114 | 17.0 | -38.1 | 233 653 | -32.8 |
| The mainland trade balance | -15 736 | 10.4 | -19.9 | -181 436 | -11.2 |
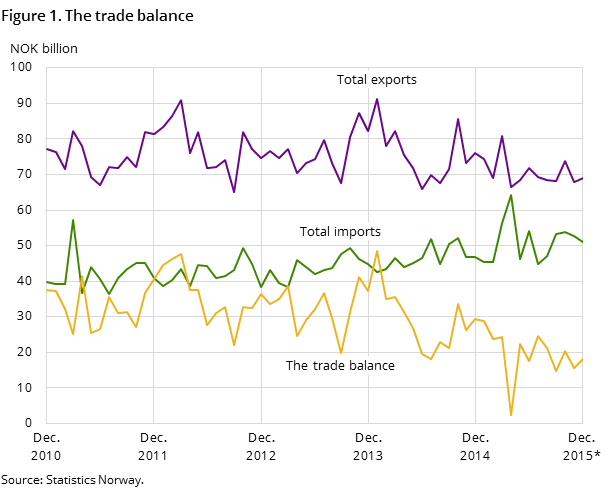
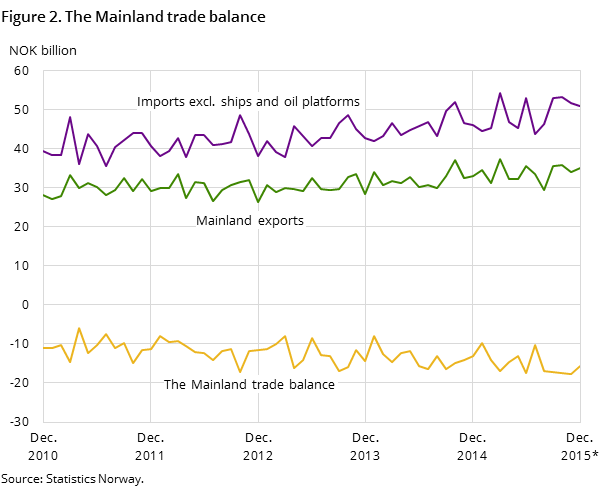
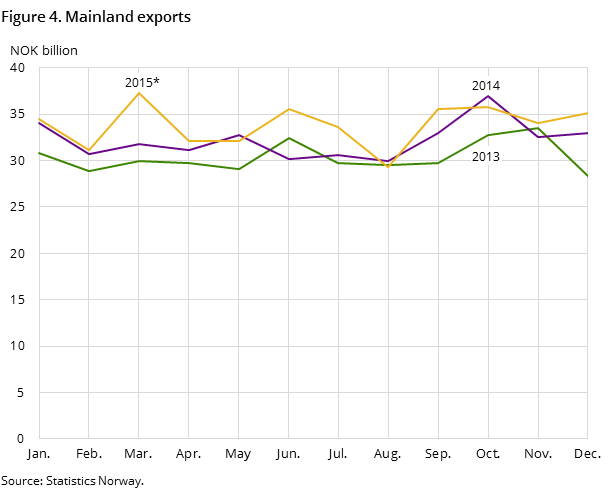
Although mainland exports in December rose by 6.3 per cent, or NOK 2.1 billion, shelf goods decreased by 20.9 per cent, or NOK 8.8 billion, and thus pulled down the total export value. Difficult times in the oil industry are influenced by low oil prices and the resulting uncertainty in oil-related industries. A weaker exchange rate dampened the decline in value, while Norwegian exporters are reaping the benefits of the currency effect. Imports of goods on the other hand increased by 9.0 per cent, equivalent to NOK 4.2 billion in December.
Changing times in the oil business
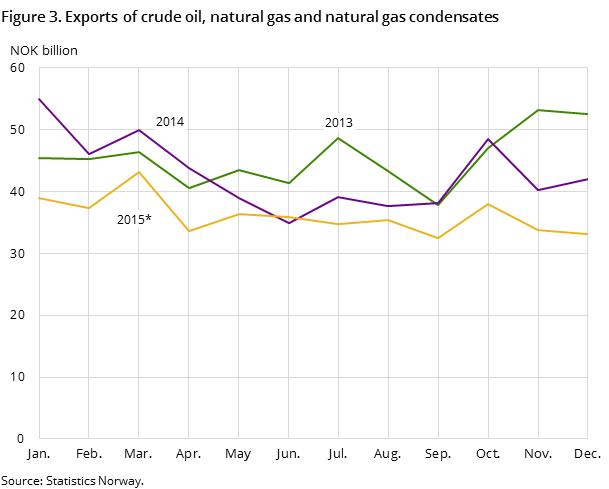
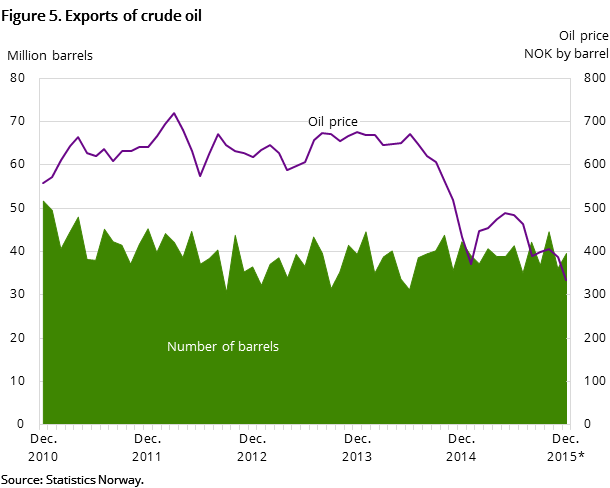
In December, the export value of crude oil ended at NOK 13.3 billion, down NOK 5.0 billion compared to the same month last year. The number of exported barrels was slightly lower, while the average price per barrel of crude oil was NOK 335 in December. The average price per barrel of crude oil was NOK 98 less than in December 2014 and as much as NOK 341 less than in December 2013. Crude oil prices have therefore more than halved in two years, and there is no guarantee that they will return to a high level.
The export value of natural gas came to NOK 19.8 billion in December. The export volume came to 10.6 billion standard cubic metres of natural gas in gaseous state. Despite a somewhat higher export volume this year, reduced prices muted the volume effect compared with December 2014.
High demand for power machinery
Mainland exports totalled NOK 35.1 billion compared to NOK 33.0 billion in December last year.
Exports of the main commodity group machinery and transport equipment, manufactured goods reached NOK 8.4 billion in December, up 4.3 per cent from December 2014. Higher exports of power generating machinery and equipment contributed to the increase. At the same time, exports of chemicals and related goods went up almost 21.1 per cent, thus reaching NOK 4.6 billion.
On the other hand, exports of liquefied propane and butane fell, from NOK 1.7 billion in December 2014 to NOK 1.2 billion in December this year. Exports of manufactured goods also went down with the value of exports in December, partly due to lower volumes and prices for metals as well as iron and steel.
Norwegian fish highly sought after
Exports of fish rose by almost NOK 900 million to NOK 7.1 billion in December. Salmon exports alone increased by NOK 738 million. Along with frozen mackerel and clip fish of cod, at a total value of more than NOK 96 million, these three species covered almost the entire rise in December. Both export volume and price of fresh whole salmon showed a significant increase compared with December 2014. Cod exports showed a similar trend, with growth in both volume and price. Poland and France received the most fish measured in both volume and value, with NOK 769 million and NOK 725 million respectively.
High demand for electric vehicles
Imports in December ended at NOK 50.9 billion, up NOK 4.2 billion compared to a year ago.
Imports of the main commodity group machinery and transport equipment climbed the most and came to NOK 21.8 billion; NOK 2.8 billion more than in December 2014. Imports of road vehicles went up almost NOK 1.0 billion in December. The number of passenger cars imported was the highest since October 2014. A high share of electric vehicles in December 2015 contributed to the increase. The subgroup other transport equipment came to NOK 2.3 billion in December. However, this subgroup often shows large fluctuations due to large individual transactions of goods such as ships and airplanes.
While imports of manufactured goods were level with December one year ago, the main group miscellaneous manufactured articles increased. The import value reached NOK 8.2 billion, and brought us more professional and scientific instruments, prefabricated buildings, clothes and shoes compared to a year ago. Imports of chemicals and related products as well as refined mineral products, however, decreased.
Winter sports
The winter season is upon us again, and the ski import indicates that a lot of skiing is likely to be done. We received nearly 19 000 pairs of alpine skis and just as many cross-country skis in December. This was almost triple as many alpine skis as in December 2014, but 13 000 fewer cross-country skis. Most of the skis we received in December originated from the Czech Republic and Ukraine.
Contact
-
Information services external trade
E-mail: utenrikshandel@ssb.no
-
Nina Rolsdorph
E-mail: nina.rolsdorph@ssb.no
tel.: (+47) 41 51 63 78
-
Jan Olav Rørhus
E-mail: jan.rorhus@ssb.no
tel.: (+47) 40 33 92 37
