Content
Published:
This is an archived release.
Record high imports in March
Imports of goods amounted to a record NOK 55.8 billion, while exports came to NOK 76.5 billion in March. This resulted in a trade surplus of NOK 20.7 billion; NOK 13.6 billion lower than the same month in 2014.
| NOK Million | Change in per cent | NOK Million - so far this year | Change in per cent - so far this year | ||
|---|---|---|---|---|---|
| March 2015 | February 2015 - March 2015 | March 2014 - March 2015 | March 2015 | March 2014 - March 2015 | |
| 1The high percentage change for the period February 2015-March 2015 is correct. The change is due to low import figures in February and the import of a storage vessel for crude oil in March. | |||||
| 2The figures are marked with the symbol *. This is Statistics Norways standard symbol for indicating preliminary figures. | |||||
| 3Due to the data collection method, the preliminary monthly figures published for ships and oil platforms are often incomplete. In retrospect, therefore, the trade in these goods could in some cases lead to major corrections in the figures. Please see tables 2-4 for the impact these figures have on the external trade. | |||||
| Imports | 55 830 | 23.0 | 19.4 | 146 526 | 10.5 |
| Ships and oil platforms13 | 1 900 | 189 900.0 | 1 819.2 | 2 950 | 332.6 |
| Exports | 76 522 | 13.2 | -5.6 | 217 142 | -12.8 |
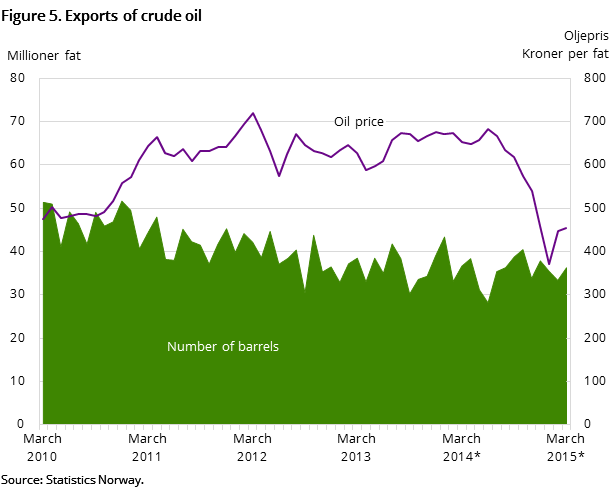
| Crude oil | 16 477 | 10.6 | -31.1 | 44 529 | -40.9 |
| Natural gas | 24 108 | 18.4 | -0.8 | 68 555 | -2.4 |
| Natural gas condensates | 644 | 108.4 | -5.6 | 1 325 | -48.2 |
| Ships and oil platforms3 | 124 | -76.2 | -53.7 | 1 374 | -63.6 |
| Mainland exports | 35 170 | 11.6 | 10.3 | 101 358 | 4.4 |
| The trade balance | 20 692 | -6.7 | -39.7 | 70 616 | -39.3 |
| The mainland trade balance | -18 761 | -35.0 | -27.0 | -42 217 | -21.3 |
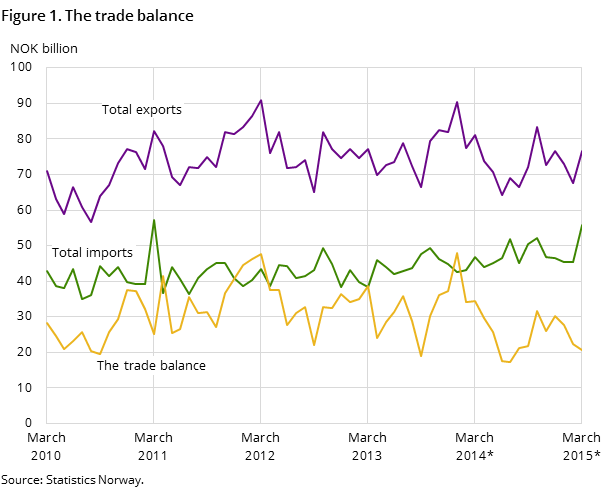
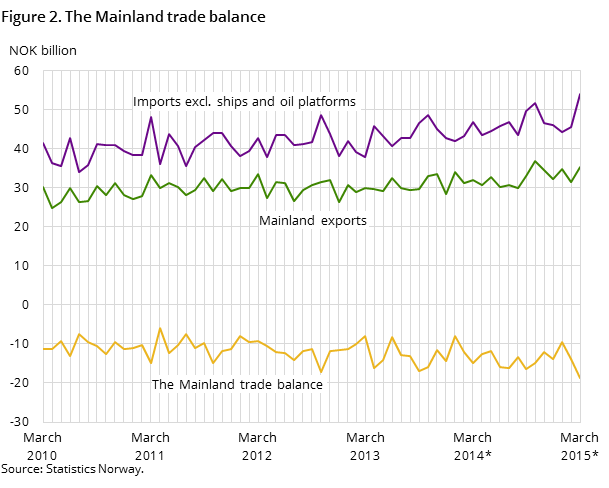
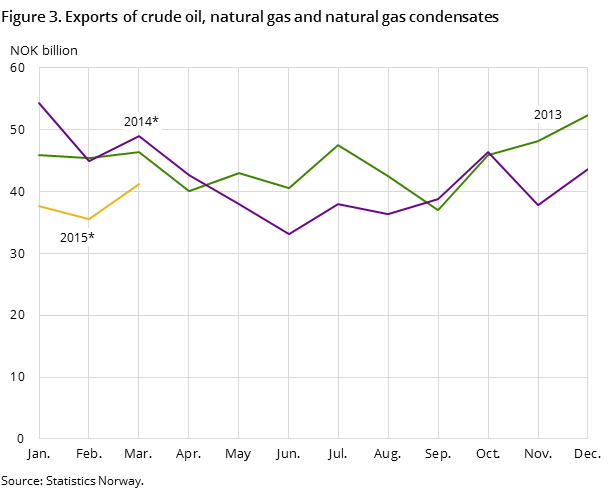
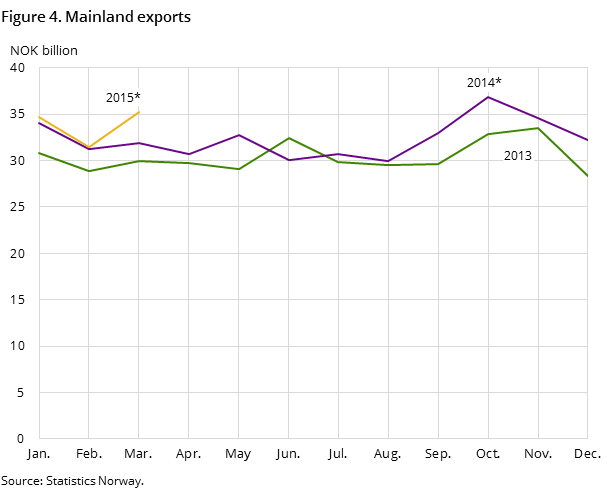
Imports in March rose by 19.4 per cent or NOK 9.1 billion, while exports declined 5.6 per cent or NOK 4.5 billion. Low oil prices continued to pull down the export value of crude oil, while mainland exports on the other side increased.
Still low crude oil price
In March, the export value of crude oil ended at NOK 16.5 billion, down NOK 7.4 billion from March last year. The number of exported barrels of crude oil was lower as was the average price per barrel. In March, the average price per barrel of crude oil was NOK 454. This was NOK 198 less than in March 2014, but NOK 7 more than the previous month.
Exports of natural gas came to NOK 24.1 billion in March this year, which was on a par with March 2014. We exported 10.2 billion cubic metres of natural gas in a gaseous state. Despite a higher export volume, lower prices reduced the volume effect compared with March 2014.
Greater demand for machinery and metal products
In March, mainland exports totalled NOK 35.2 billion compared to NOK 31.9 billion in March last year.
Exports of the main commodity group machinery and transport equipment manufactured goods reached NOK 8.1 billion in March, up 24.8 per cent from March 2014. The subgroups machinery for special industries together with power generating machinery and equipment increased NOK 1.2 billion. Exports of non-ferrous metals rose in March, with a growth close to NOK 830 million, and thus reached NOK 4.0 billion.
High exports of fish
In March, fish exports went up by NOK 700 million to NOK 6.3 billion. Exports of salmon and cod rose by NOK 518 and NOK 143 million respectively and covered almost the entire increase. The export volume of salmon rose considerably compared with March last year, while the price was lower this year. Cod exports on the other hand showed lower exported volumes, but significantly higher prices in March this year. Measured in value, we exported most fish to Poland and France, with NOK 686 and NOK 549 million each.
Exports of liquefied propane and butane dropped from NOK 2.0 billion in March 2014, to NOK 580 million in March 2015.
Large machine imports
Imports in March reached a record NOK 55.8 billion; an increase from March last year of NOK 9.1 billion, or 19.4 per cent.
The main commodity group machinery and transport equipment came to NOK 22.9 billion in March; NOK 4.5 billion more than March 2014. Other transport equipment came to NOK 3.5 billion and imports of storage vessels for crude oil with a value of NOK 1.5 billion accounted for almost the entire increase in this subgroup. We also received more machinery and cars.
Imports of miscellaneous manufactured goods and manufactured goods showed a joint increase of NOK 2.7 billion compared with March last year. The import value amounted to NOK 9.3 and NOK 8.4 billion respectively.
New season arriving
A seasonal effect is also reflected in the March import figures – with high imports of commodities such as clothing, shoes and sunglasses. We received 1 300 tonnes more clothing than the same month last year, with a value of NOK 1.9 billion. Imports of shoes reached NOK 600 million in March; an increase of NOK 170 million. Furthermore, sunglasses at a value of NOK 30.5 million, and 120 000 more than the same month last year crossed the Norwegian border. China totally dominates as a supplier of these goods.
Contact
-
Information services external trade
E-mail: utenrikshandel@ssb.no
-
Nina Rolsdorph
E-mail: nina.rolsdorph@ssb.no
tel.: (+47) 41 51 63 78
-
Jan Olav Rørhus
E-mail: jan.rorhus@ssb.no
tel.: (+47) 40 33 92 37
