Content
Published:
This is an archived release.
Low trade surplus in February
Imports of goods reached NOK 45.1 billion in February 2015, while exports amounted to NOK 66.2 billion. This resulted in a drop in the trade surplus drop of NOK 13.1 billion compared to February 2014. As expected the oil price contributed strongly to the drop, however there was a decrease also in mainland exports.
| NOK Million | Change in per cent | NOK Million - so far this year | Change in per cent - so far this year | ||
|---|---|---|---|---|---|
| February 2015 | January 2015 - February 2015 | February 2014 - February 2015 | February 2015 | February 2014 - February 2015 | |
| 1The figures are marked with the symbol *. This is Statistics Norways standard symbol for indicating preliminary figures. | |||||
| 2Due to the data collection method, the preliminary monthly figures published for ships and oil platforms are often incomplete. In retrospect, therefore, the trade in these goods could in some cases lead to major corrections in the figures. Please see tables 2-4 for the impact these figures have on the external trade. | |||||
| Imports | 45 148 | 0.1 | 4.4 | 90 236 | 5.2 |
| Ships and oil platforms2 | 1 | -99.9 | -98.9 | 849 | 45.6 |
| Exports | 66 169 | -9.4 | -14.5 | 139 201 | -17.1 |
| Crude oil | 14 897 | 13.2 | -33.1 | 28 052 | -45.4 |
| Natural gas | 20 357 | -15.5 | -4.7 | 44 448 | -3.2 |
| Natural gas condensates | 309 | -17.2 | -76.1 | 682 | -63.7 |
| Ships and oil platforms2 | 517 | -29.2 | -59.7 | 1 247 | -64.4 |
| Mainland exports | 30 089 | -13.2 | -3.5 | 64 772 | -0.6 |
| The trade balance | 21 021 | -24.8 | -38.4 | 48 964 | -40.3 |
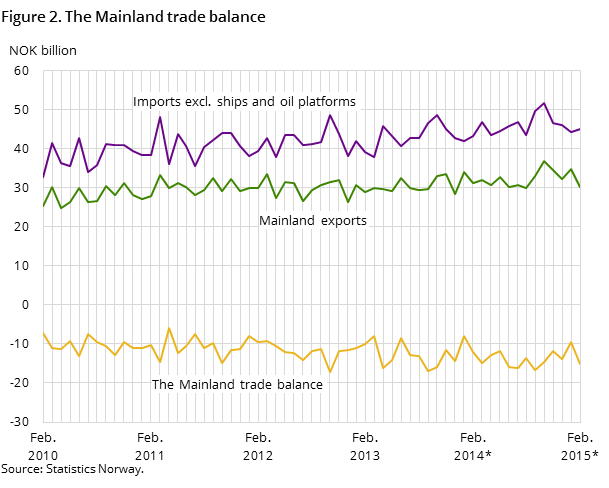
| The mainland trade balance | -15 058 | -57.6 | -25.7 | -24 615 | -22.8 |
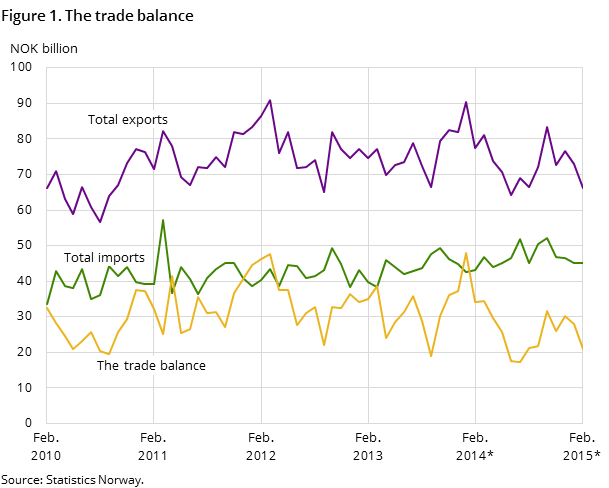
The trade balance herby ended at NOK 21.0 billion in February 2015, down 38.4 per cent from February 2014. This is a low trade surplus for Norwegian external trade. Imports were up 4.4 per cent –exports were down 14.5 per cent.
Oil- and gas exports down
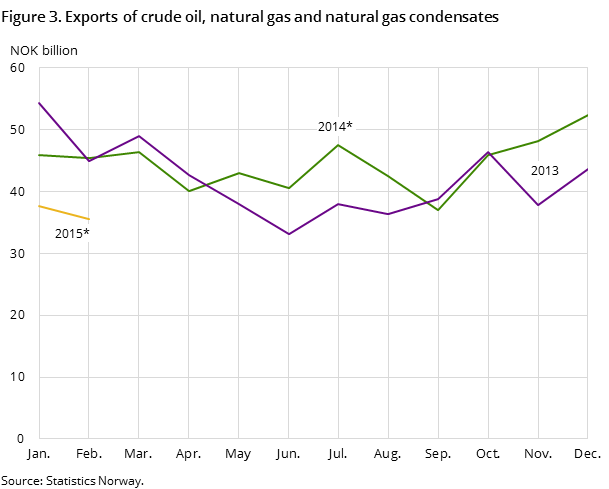
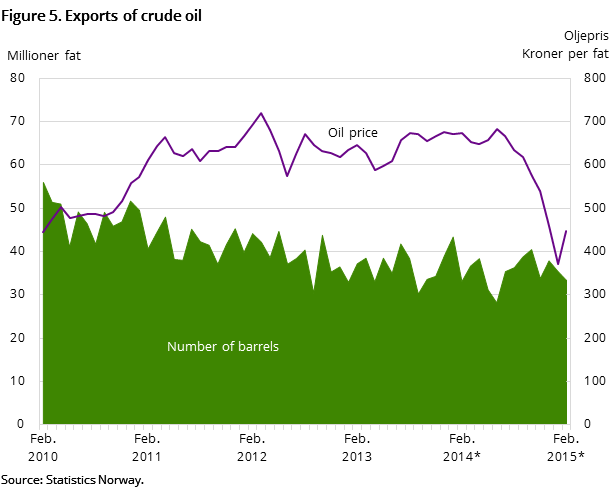
Crude oil exports totalled at NOK 14.9 billion in February - a decrease of NOK 7.4 billion compared with the same month in 2014. The number of barrels was 33.4 million – a slight increase of 245 thousand barrels. Thereby the low oil price explains the decline in the exports value. The crude oil price was NOK 447 in February 2015, down NOK 226 form the same month the previous year. On the contrary, the oil price was up 20,4 per cent compared to January 2015. Hence the value of the exports is NOK 1.7 billion higher than last month.
The export value of natural gas in gaseous state ammounted to NOK 19.8 billion in February 2015, down NOK 430 million down from February 2014. A total of 9.5 billion cubic metres of natural gas in gaseous state were exported – more than 900 million cubic metres more than the year before. The price however was slightly down compared to February 2014.
Drop in exports of fish and refined mineral products
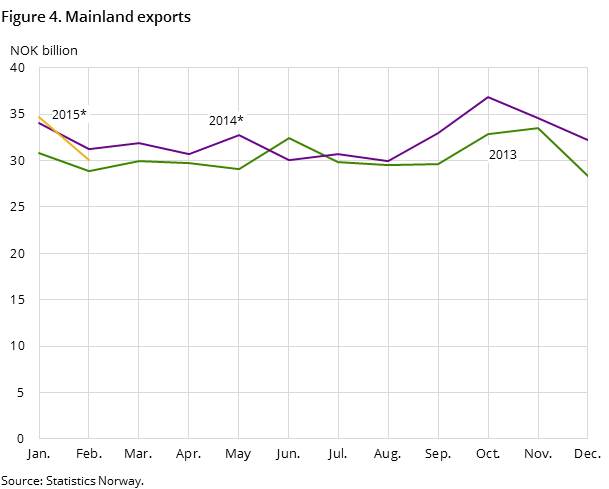
Mainland exports reached NOK 30.1 billion and were 3.5 per cent lower than in February 2014.
The exports of refined mineral products dropped by more than 60 per cent, ending at NOK 1.7 billion in February 2015. This is NOK 2.9 billion down from the same month in 2014 and the lowest figures since 2010. Both the price and exported quantity is lower. The export of naphtha was NOK 527 million in February 2015, while it was NOK 1.3 billion in the same month in 2014.
Exports of fish in February 2015 ended at more than NOK 5.1 billion. Down NOK 127 million this was slightly lower than in 2014. However, anyway a quite high fish exports for the month of February. The value of total exports of salmon was up by NOK 62.5 million, ending at NOK 3.3 billion. This was due to increased exports of fillets and frozen farmed salmon. Furthermore the export of cod was down by NOK 93.5 billion – and the export of spawning cod is still low.
On the contrary, exports of metals were up in February 2015. The export of iron and steel increased by NOK 247 million – and the export of non-ferrous metals was up by NOK 635 million compared to February 2014. There has been an increase in the price of aluminium since last year.
Electrical car imports second highest ever registered
Imports amounted to NOK 45.1 billion in February 2015, up 4.4 per cent, compared to February 2014.
Car imports jumped by NOK 307 million compared to February 2014, ending at almost NOK 3.1 billion. This is among the highest imports value ever registered. The import of electrical cars contributes by NOK 716 million in this month. This is the next highest value and number since last record, in the month of March 2014.
Imports of crude materials were up from NOK 2.2 billion to 2.6 billion. This was explained by the increase in imports of metalliferous ores - an increase of 17.9 per cent compared to February 2014. The main commodity group miscellaneous manufactured articles had increased imports by NOK 1.2 billion.
Contact
-
Information services external trade
E-mail: utenrikshandel@ssb.no
-
Nina Rolsdorph
E-mail: nina.rolsdorph@ssb.no
tel.: (+47) 41 51 63 78
-
Jan Olav Rørhus
E-mail: jan.rorhus@ssb.no
tel.: (+47) 40 33 92 37
