Content
Published:
This is an archived release.
9 February 2015: Import values on snuff in the period from 2009 to 2011 is wrong, revised figures will be published as soon as possible.
Drop in oil price pulled trade surplus down
Imports of goods reached NOK 46.6 billion in December, while exports amounted to NOK 76.7 billion. This resulted in a trade surplus drop of NOK 7.0 billion compared to December 2013. The drop in the oil exports contributed strongly to the drop, while the increased mainland exports pulled in the opposite direction.
| NOK Million | Change in per cent | NOK Million - so far this year | Change in per cent - so far this year | ||
|---|---|---|---|---|---|
| December 2014 | November 2014 - December 2014 | December 2013 - December 2014 | December 2014 | December 2013 - December 2014 | |
| 1The figures are marked with the symbol *. This is Statistics Norways standard symbol for indicating preliminary figures. | |||||
| 2Due to the data collection method, the preliminary monthly figures published for ships and oil platforms are often incomplete. In retrospect, therefore, the trade in these goods could in some cases lead to major corrections in the figures. Please see tables 2-4 for the impact these figures have on the external trade. | |||||
| Imports | 46 606 | -0.2 | 3.9 | 560 723 | 6.2 |
| Ships and oil platforms2 | 508 | 252.8 | -76.0 | 10 757 | -1.3 |
| Exports | 76 744 | 5.6 | -6.4 | 897 810 | -0.9 |
| Crude oil | 17 420 | -4.6 | -34.2 | 269 601 | -3.0 |
| Natural gas | 25 717 | 34.8 | 1.7 | 224 988 | -9.5 |
| Natural gas condensates | 482 | -3.3 | -15.2 | 8 007 | -3.2 |
| Ships and oil platforms2 | 905 | 483.9 | -32.9 | 7 099 | 1.5 |
| Mainland exports | 32 219 | -7.0 | 13.8 | 388 115 | 6.5 |
| The trade balance | 30 138 | 16.3 | -18.9 | 337 087 | -11.0 |
| The mainland trade balance | -13 879 | -16.4 | 3.7 | -161 851 | -6.3 |
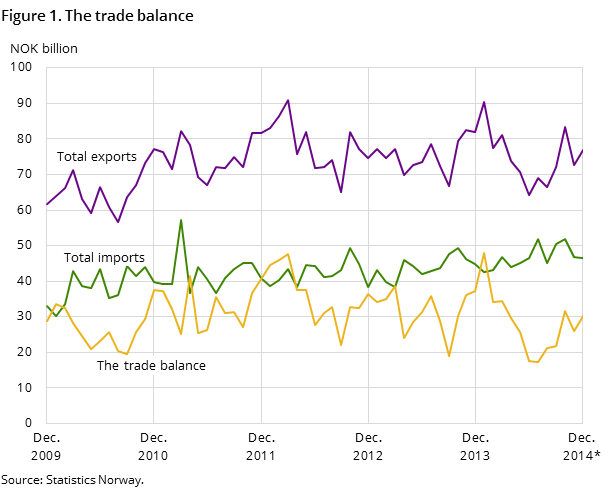
The trade balance herby ended at NOK 30.1 billion in December 2014, down 18.9 per cent from December 2013. Imports were up 3.9 per cent – or NOK 1.8 billion – while exports were down 6.4 per cent, which corresponds to NOK 5.3 billion.
Falling oil price reduced oil exports by NOK 9 billion
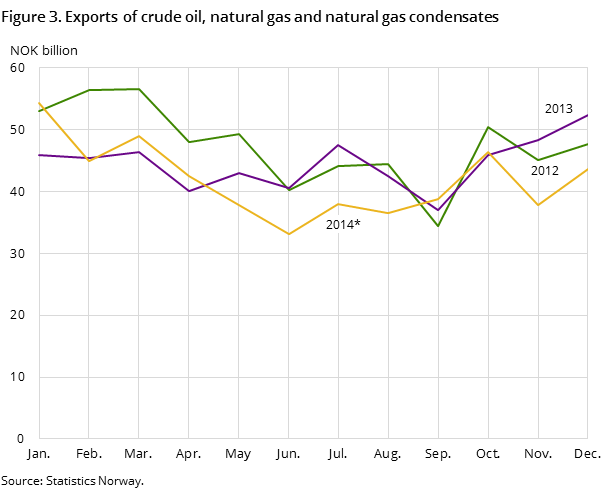
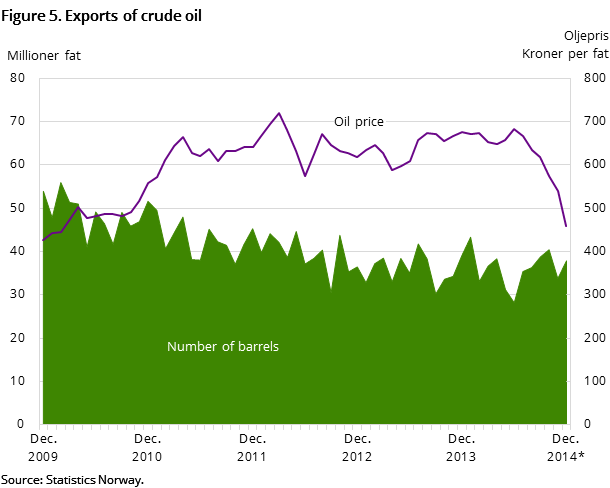
Crude oil exports totalled NOK 17.4 billion in December - a decrease of 18.9 per cent compared with the same month in 2013. The export value of crude oil in November and December 2014 is thereby at the same level as in the first quarter of 2009, when the financial crisis affected the oil price. The crude oil price was NOK 460 in December 2014, down NOK 217 from the same month the previous year. The number of barrels also dropped by 1.2 million compared to December 2013.
The export value of natural gas was NOK 24.7 billion in December 2014, almost the same as in 2013. A total of 10.5 billion cubic metres of natural gas in a gaseous state were exported - 869 million cubic metres more than the year before. The price however was slightly down compared to December 2013.
Increased exports of metals, fish and animal food
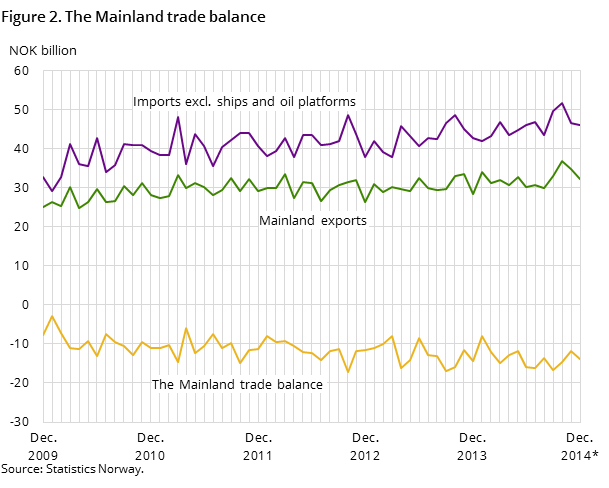
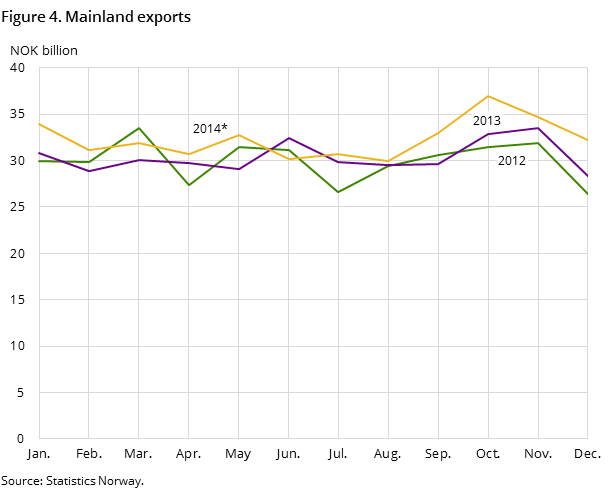
Mainland exports reached NOK 33.2 billion and were 13.8 per cent or NOK 3.9 billion higher than in December 2013.
The exports of manufactured goods came to NOK 5.8 billion, up 22.8 per cent from December 2013.
This was explained mostly by the exports of metals and manufactures thereof. The growth was NOK 941 million, and the total was almost NOK 5 billion. Exports of metals other than iron and steel grew the most. The price of aluminium was up, while the exported quantity was down.
Exports of fish in December 2014 ended at just over NOK 6.2 billion, slightly higher than in December 2013, when the export was also high. This is the fifth highest monthly export value ever registered. The value of total exports of salmon was down, while cod, haddock and mackerel values were up.
There was also a high increase in exports of feeding stuff for animals – almost a tripling to NOK 409 million. Exports of chemicals were up 26.9 per cent, ending at NOK 826 million. Furthermore, the exports of power generating machinery and general industrial machinery were up, with NOK 1.2 billion.
More electric cars, but fewer mobile phones and computers were imported
Imports in August amounted to NOK 46.6 billion in December 2014, an increase of NOK 1.8 billion - or 3.9 per cent, compared to December 2013.
Imports of crude materials were up from NOK 2.5 billion to 2.8 billion – explained by the increase in imports of metalliferous ores by NOK 330 million. This was an increase of 20.9 per cent.
The main commodity group machinery and transport equipment was down by NOK 420 million – or 2.2 per cent from December 2013. This was partly due to the drop in imports of the subgroup other transport equipment, including both aeroplanes and ships, which normally has quite a high variation. Imports of machinery for special industries and general industrial machinery increased by a total of NOK 613 million.
Car imports jumped by NOK 350 million compared to December 2013, ending at almost NOK 3.5 billion. This is the second highest import value ever registered, only March 2014 was higher. The import of electrical cars was NOK 680 million in December 2014 – also the second highest value and number registered.
In the opposite direction, some popular electronic consumer goods saw a fall, with lower imports of mobile phones and portable computers. The import of mobile phones was NOK 611 million, down NOK 275 million from December 2014. With regard to computers, including tablets, the drop was NOK 102 million – resulting in an import value of NOK 689 million in December 2014.
Contact
-
Information services external trade
E-mail: utenrikshandel@ssb.no
-
Nina Rolsdorph
E-mail: nina.rolsdorph@ssb.no
tel.: (+47) 41 51 63 78
-
Jan Olav Rørhus
E-mail: jan.rorhus@ssb.no
tel.: (+47) 40 33 92 37
