Content
Published:
This is an archived release.
Record high fish exports
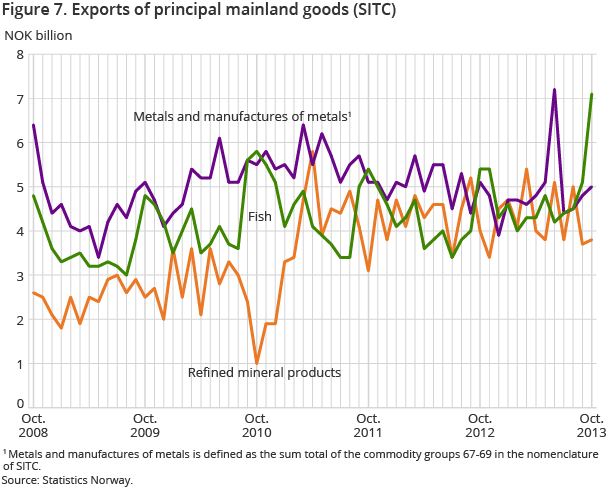
The trade surplus in October came to NOK 26.7 billion. This was an increase of 30.4 per cent from September, but a decline of 18 per cent from October last year. Fish exports came to a record high NOK 7.1 billion, which was more than NOK 1 billion higher than the previous record from October 2010.
| NOK Million | Change in per cent | NOK Million - so far this year | Change in per cent - so far this year | ||
|---|---|---|---|---|---|
| October 2013 | September 2013 - October 2013 | October 2012 - October 2013 | October 2013 | October 2012 - October 2013 | |
| 1The figures are marked with the symbol *. This is Statistics Norways standard symbol for indicating preliminary figures. | |||||
| 2Due to the data collection method, the preliminary monthly figures published for ships and oil platforms are often incomplete. In retrospect, therefore, the trade in these goods could in some cases lead to major corrections in the figures. Please see tables 2-4 for the impact these figures have on the external trade. | |||||
| Imports | 48 896 | 4.5 | -1.1 | 434 744 | 2.4 |
| Ships and oil platforms2 | 518 | -47.9 | -28.7 | 7 462 | 7.1 |
| Exports | 75 643 | 12.4 | -7.8 | 740 267 | -5.6 |
| Crude oil | 21 731 | 5.6 | -21.7 | 229 311 | -12.5 |
| Natural gas | 19 787 | 20.6 | -9.3 | 196 858 | -4.1 |
| Natural gas condensates | 745 | 30.0 | -18.4 | 6 916 | -27.8 |
| Ships and oil platforms2 | 344 | 5 633.3 | 358.7 | 4 772 | -3.9 |
| Mainland exports | 33 037 | 11.2 | 4.8 | 302 411 | 0.2 |
| The trade balance | 26 747 | 30.4 | -18.0 | 305 523 | -15.0 |
| The mainland trade balance | -15 341 | 4.5 | 10.8 | -124 871 | -7.9 |
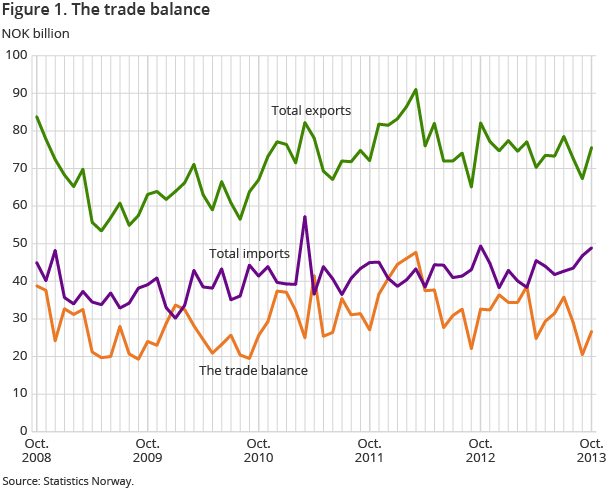
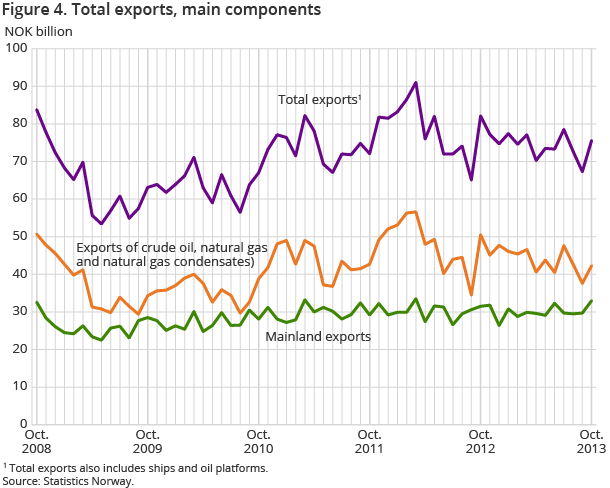
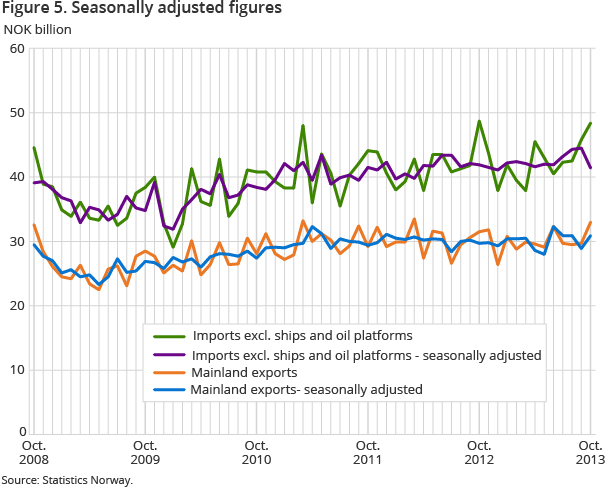
The value of imports was NOK 48.9 billion in October, up 4.5 per cent from last month but down 1.1 per cent from the same month last year. The exports at NOK 75.6 billion, increased by 12.4 per cent from last month, but declined by 7.8 per cent from October 2012.
Decline in crude oil exports
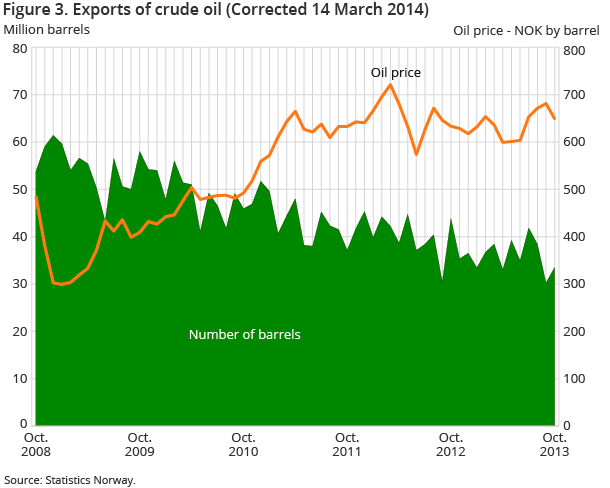
The value of crude oil exports was NOK 21.7 billion in October. This was down 21.7 per cent from the same month last year. The mean price of a barrel of crude oil was NOK 649. Furthermore, 33.5 million barrels were exported in October, which was about 3 million barrels more than in September, but a decline of over 10 million barrels from October last year.
Decline in the exports of natural gas
In October, the natural gas exports came to NOK 19.8 billion. This was a decline of 9.3 per cent from October 2012 but an increase of 20.6 per cent from last month. The volume of exports for natural gas in a gaseous state was 8.9 billion standard cubic metres. This was about 500 million cubic metres fewer than October last year.
Increase in mainland exports
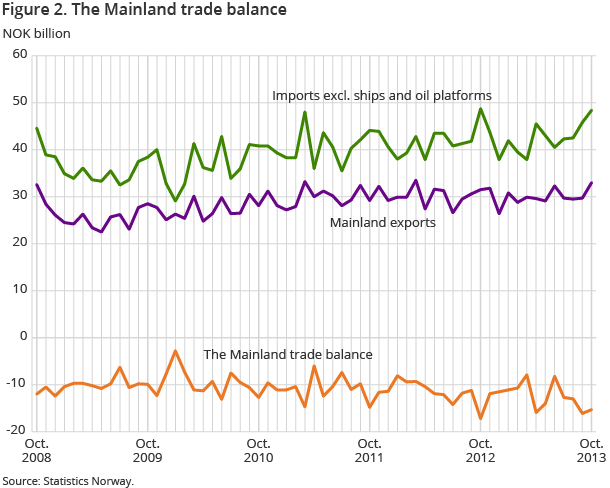
Mainland exports came to NOK 33 billion in October. This was a rise of 4.8 per cent from October last year, and 11.2 per cent higher than September 2013.
The export value of fish increased by NOK 1.8 billion compared to a year ago. This was the first time the export of fish was higher than NOK 6 billion, and was partly due to the monthly mean price of exported fresh salmon, which was more than NOK 10 higher than October last year.
The large increase in the export of fish led to the main group of food and live animals being higher than the historically largest export groups, excluding mineral fuels. The export of food and live animals was almost NOK 1.8 billion higher in October than the group manufactured goods classified chiefly by material, and about NOK 1 billion higher than the group machinery and transport equipment. Otherwise, the group general industrial machinery and equipment increased by NOK 411 million to NOK 1.8 billion compared to October last year.
The biggest decline was in the group miscellaneous manufactured articles, n.e.s., which came to NOK 601 million in October, down NOK 319 million compared to a year ago.
Marginal downturn in imports
In October, imports came to NOK 48.9 billion, down 1.1 per cent from a year ago.
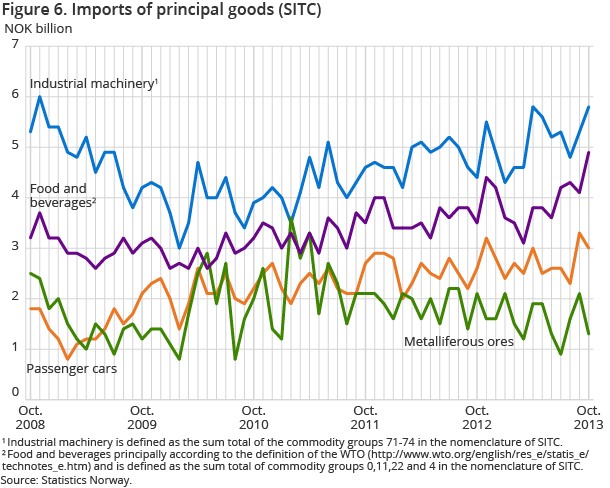
The sub-group general industrial machinery and equipment came to about NOK 3 billion, which was an increase of NOK 290 million. Furthermore, the import value of the sub-group electrical machinery and apparatus increased by NOK 306 million to NOK 2.9 billion compared to October 2012. Altogether, the main group machinery and transport equipment still fell by about NOK 1 billion compared to a year ago. The main reason was a downturn in the sub-group other transport equipment including ships. The nature of the commodities in this group may lead the group to exhibit large fluctuations from month to month. This time, the import of aeroplanes was higher in October last year.
Contact
-
Information services external trade
E-mail: utenrikshandel@ssb.no
-
Nina Rolsdorph
E-mail: nina.rolsdorph@ssb.no
tel.: (+47) 41 51 63 78
-
Jan Olav Rørhus
E-mail: jan.rorhus@ssb.no
tel.: (+47) 40 33 92 37
