Content
Published:
This is an archived release.
Due to technical errors we had to edit our tabels on Friday the 12th. The figures in the text and the tables will be slightly different. The figures in the tables are those revised by the end of March.
Decline in external trade
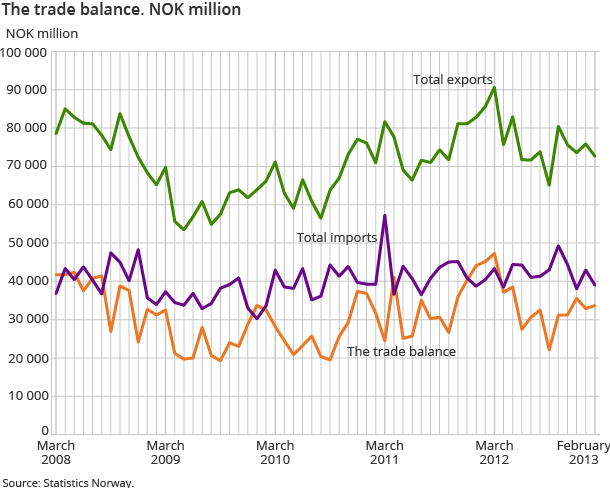
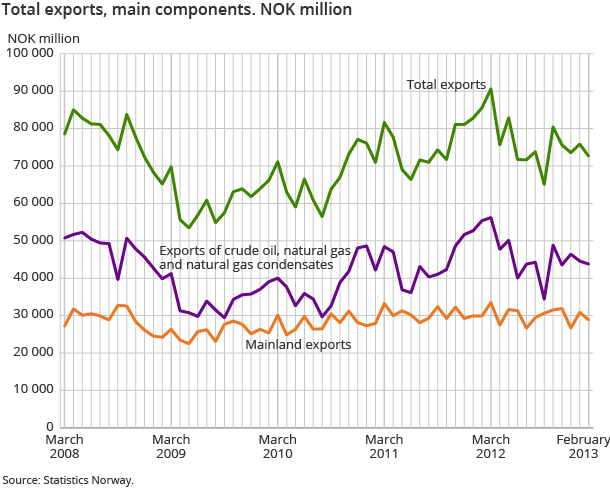
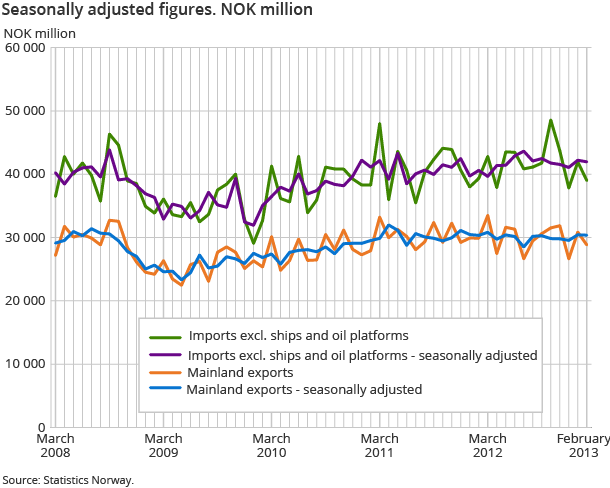
Imports came to nearly NOK 39 billion in February, down NOK 1.4 billion compared to the corresponding month in 2012. Exports fell to NOK 72.6 billion, down NOK 13 billion compared to February 2012, when the export value totalled NOK 85.6 billion.
| NOK Million | Change in per cent | NOK Million - so far this year | Change in per cent - so far this year | ||
|---|---|---|---|---|---|
| February 2013 | January 2013 - February 2013 | February 2012 - February 2013 | February 2013 | February 2012 - February 2013 | |
| 1Due to the data collection method, the preliminary monthly figures published for ships and oil platforms are often incomplete. In retrospect, therefore, the trade in these goods could in some cases lead to major corrections in the figures. Please see tables 2-4 for the impact these figures have on the external trade. | |||||
| Imports | 40 127 | -6.6 | -0.7 | 83 081 | 4.9 |
| Ships and oil platforms1 | 646 | -36.3 | -41.2 | 1 660 | 63.7 |
| Exports | 72 991 | -3.7 | -14.7 | 148 821 | -11.6 |
| Crude oil | 24 018 | 13.9 | -21.4 | 45 108 | -21.2 |
| Natural gas | 19 284 | -13.4 | -18.6 | 41 549 | -14.8 |
| Natural gas condensates | 476 | -60.6 | -57.5 | 1 673 | -19.7 |
| Ships and oil platforms1 | 415 | -5.7 | 42.6 | 855 | 67.3 |
| Mainland exports | 28 809 | -6.5 | -3.6 | 59 637 | -0.3 |
| The trade balance | 32 863 | 0.0 | -27.2 | 65 740 | -26.3 |
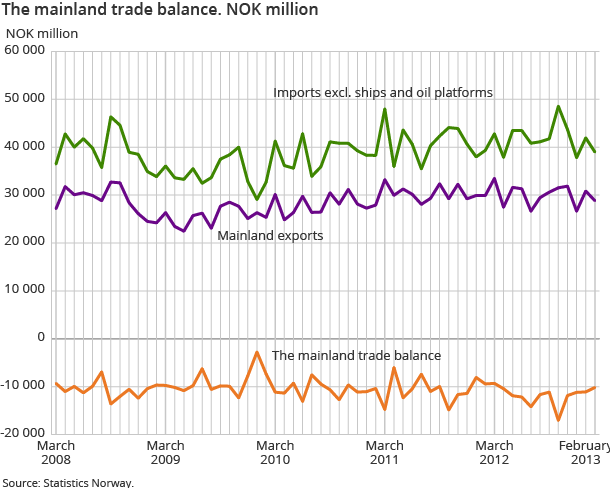
| The mainland trade balance | -10 672 | 4.0 | -13.2 | -21 784 | 24.5 |
The trade surplus amounted to NOK 33.7 billion in February 2013, which is NOK 11.5 billion less than for the same period last year, when the surplus was NOK 45.2 billion.
Lower exports of oil and gas
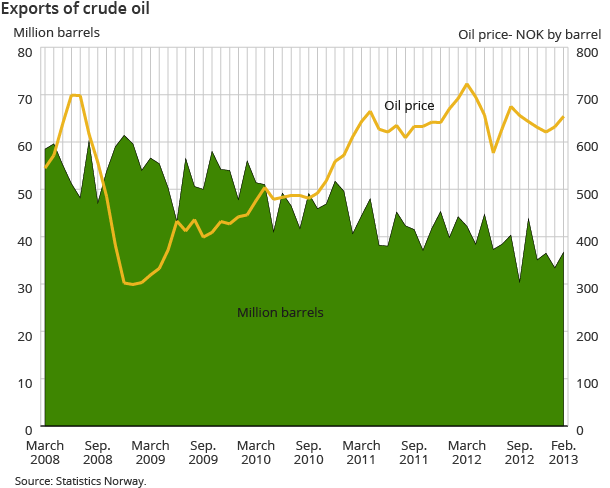
The value of crude oil exports totalled NOK 24 billion in February, compared to NOK 30.6 billion in the same month a year earlier. The fall was mainly due to a drop in export volumes by 7.4 barrels compared to February 2012. The average price per barrel was NOK 654 in February 2013, compared to NOK 692 in the same month the year before.
Exports of natural gas amounted to 8.8 billion cubic metres of natural gas in a gaseous state in February, compared with 10 billion Sm3 in the same period last year. The value of exports came to over NOK18 billion, almost NOK 5 billion more than in February 2012.
Decline in exports of manufactured goods, fish and electricity
Mainland exports amounted to NOK 28.8 billion in February 2013 compared to NOK 29.9 billion in the same month last year.
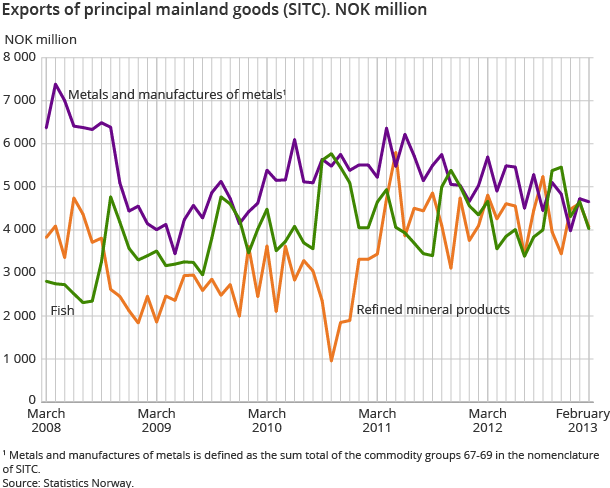
The main group of manufactured goods totalled around NOK 5.4 billion in February, a decrease of NOK 466 million compared to the same month in the previous year. Most of the decline was within the group metals, except ferrous metals, where a drop in exports of aluminium amounted to around NOK 375 million. Aluminium exports came to NOK 1.7 billion in February. Exports of paper and paperboard fell, and ended at NOK 359 million in February 2013. This is NOK 114 million lower than for February last year.
Despite almost NOK 2 billion in exports of whole fresh salmon in February; an increase of NOK 391 million compared to the same month in 2012, fish exports fell by NOK 324 million. A large part of the decline in fish exports was due to lower exports of dried, salted and smoked fish. This commodity group fell to NOK 347 million, a decrease of more than NOK 200 million compared to February last year. Exports of electricity also fell and came to around NOK 1/2 billion less in February compared to the same month a year back.
Increased exports of electrical machinery, manufactures of metal and scientific and technical instruments
Within the group machinery and transport equipment, exports increased by NOK 229 million for electrical machinery in February and totalled NOK 1.2 billion. There were also an increase in exports for metals, which increased by NOK 231 million. In the main group, miscellaneous manufactured goods, the group scientific and technical instruments in particular saw an increase. The export value for these commodities totalled NOK 976 million in February 2013, which amounts to NOK182 million more than in February last year.
Fall in imports of ores and metal scrap and chemical products
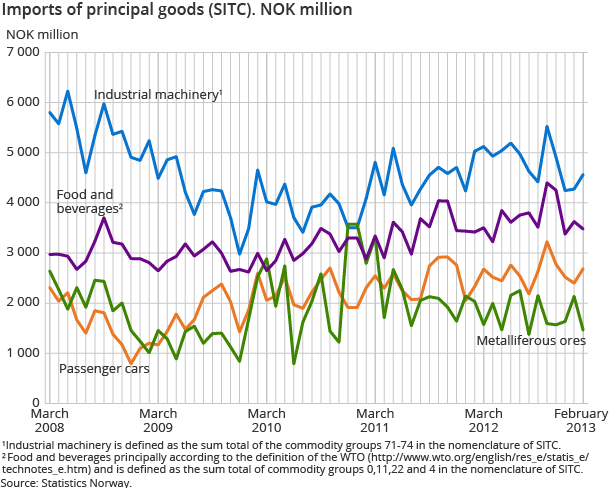
Imports of goods totalled NOK 39 billion in February, which is 3.5 per cent lower than the same month in 2012. The largest decline was found in the commodity group ores and metal scrap, which fell to NOK 1.5 billion in February; a drop of NOK 575 million compared to the same month in 2012.
Imports of chemical products also showed a marked decline and fell to NOK 3.6 billion in February, compared to over NOK 4 billion the year before. In the main group manufactured goods, which saw a decline for most of the commodity groups, there was a total fall of NOK 370 million. The import value for this group came to around NOK 5.9 billion in February 2013.
Increased imports of fuel oil, electricity and cars
The largest increase in imports was for the main group mineral fuels, where imports of refined petroleum products rose from NOK 1 billion in February 2012 to NOK 1.5 billion in the same month a year earlier. Light fuel oil totalled NOK 800 million in February and accounted for most of the increase with NOK 470 million. Imports of electric current amounted to NOK 218 million more in February than in the same month last year.
There was also a growth in imports for the group road vehicles, particularly for passenger cars, which rose by NOK 358 million compared to February 2012. The value for imported cars came to around NOK 2.7 billion in February. In total, Norway imported 1 800 more cars in February compared to the corresponding month in the previous year.
The figures now include ships and platformsOpen and readClose
Please note that as from this publication of the figures for February 2013, a slight change has been made to the figures we comment on. We previously commented on the figures excluding ships and oil platforms, but will henceforth comment on the figures including ships and oil platforms.
Contact
-
Information services external trade
E-mail: utenrikshandel@ssb.no
-
Nina Rolsdorph
E-mail: nina.rolsdorph@ssb.no
tel.: (+47) 41 51 63 78
-
Jan Olav Rørhus
E-mail: jan.rorhus@ssb.no
tel.: (+47) 40 33 92 37

