Content
Published:
This is an archived release.
All time high salmon exports
In June, exports came to NOK 67.2 billion and imports NOK 41.8 billion. The exports of salmon reached a record, while the imports of metalliferous ores is about to get back to the level before the financial crisis.
| Reference is also made to the article Trade surplus up describing the first half of 2010. |
In June the trade balance ended at NOK 25.4 billion, a rise of more than NOK 4 billion compared to June last year. The main reason is growth in exports of crude oil, but exports of natural gas also showed a small increase. When it comes to the mainland exports, the increase is slightly lower than the imports excluding ships and oil platforms. This weakens the trade balance.
Crude oil exports up in June
The value of the oil exports has remained more or less stable since October last year. This was however interrupted by a drop in January due to poor weather conditions in the North Sea and by a decline in May caused by partly closed fields.
In June, the export value of crude oil ended at NOK 24.2 billion, up NOK 5.5 billion compared to June last year. The number of barrels exported was 49.2 billion, compared to about 43 billions in June 2009. The average crude oil price in June was NOK 492, up NOK 16 from May, and up NOK 60 compared to June 2009.
Slight increase for gas exports
The value of natural gas exports came to NOK 12.7 billion June this year. This is an increase of 6.2 per cent since June last year. The number of exported cubic metres of natural gas in a gaseous state was higher than June last year, while the price was lower. Compared to last month the total gas value was 11.4 per cent lower due to lower quantity exported.
| January-June | Change in per cent | June | Change in per cent | ||||||||||||||||||||||||||||||||||||||||||||||||||||||||||||||||||||||||||||
|---|---|---|---|---|---|---|---|---|---|---|---|---|---|---|---|---|---|---|---|---|---|---|---|---|---|---|---|---|---|---|---|---|---|---|---|---|---|---|---|---|---|---|---|---|---|---|---|---|---|---|---|---|---|---|---|---|---|---|---|---|---|---|---|---|---|---|---|---|---|---|---|---|---|---|---|---|---|---|---|
| 2009 | 2010 | 2009 | 2010 | ||||||||||||||||||||||||||||||||||||||||||||||||||||||||||||||||||||||||||||
| 1 Imports | 208 545 | 216 744 | 3.9 | 36 143 | 41 784 | 15.6 | |||||||||||||||||||||||||||||||||||||||||||||||||||||||||||||||||||||||||
| 2 Exports | 374 181 | 390 487 | 4.4 | 57 549 | 67 230 | 16.8 | |||||||||||||||||||||||||||||||||||||||||||||||||||||||||||||||||||||||||
| Of which | |||||||||||||||||||||||||||||||||||||||||||||||||||||||||||||||||||||||||||||||
| Crude oil | 108 106 | 140 275 | 29.8 | 18 707 | 24 221 | 29.5 | |||||||||||||||||||||||||||||||||||||||||||||||||||||||||||||||||||||||||
| Natural gas | 115 508 | 84 259 | -27.1 | 11 979 | 12 718 | 6.2 | |||||||||||||||||||||||||||||||||||||||||||||||||||||||||||||||||||||||||
| Condensates | 3 864 | 2 731 | -29.3 | 1 137 | 488 | -57.1 | |||||||||||||||||||||||||||||||||||||||||||||||||||||||||||||||||||||||||
| 3 Exports excl. crude oil, natural gas and condensates | 146 703 | 163 222 | 11.3 | 25 725 | 29 803 | 15.9 | |||||||||||||||||||||||||||||||||||||||||||||||||||||||||||||||||||||||||
| 4 Trade balance (2-1) | 165 636 | 173 743 | 4.9 | 21 406 | 25 446 | 18.9 | |||||||||||||||||||||||||||||||||||||||||||||||||||||||||||||||||||||||||
| 5 Trade balance excl. oil, natural gas and condensates (3-1) | -61 842 | -53 522 | . | -10 418 | -11 981 | . | |||||||||||||||||||||||||||||||||||||||||||||||||||||||||||||||||||||||||
High salmon- and nickelexports
The export value in June, excluding ships, oil platforms, crude oil, condensates and natural gas, ended at NOK 29.8 billion. This is an increase of NOK 4.1 billion, or 15.9 per cent, compared to June last year.
Several commodity groups contributed to this increase. The largest growth was within the commodity group of manufactured goods. Within this group, non-ferrous metals pulled the value up, with a total growth of NOK 1.3 billion. Exports of nickel showed a considerable rise compared to June last year. The last three months, this commodity group has returned to the value level before the financial crisis. Exports of aluminium also rose this month, while the export of iron and steel climbed with about NOK 300 million.
The export value of fish increased by almost NOK 900 million compared to June last year, and reached a total value of NOK 4.1 billion. The salmon exports was all time high in June, slightly above NOK 2 billion, This is almost NOK 500 million higher than June last year and NOK 200 million more than in May 2010. This increase was mainly due to higher exported quantity.
Among other goods, exports of chemicals and related products increased by NOK 525 million in June, while petroleum products dropped by a little more than NOK 100 million.
Higher imports - metalliferous ores and cars up
The import value of goods excluding ships and oil platforms amounted to NOK 41.8 billion. This is an increase of NOK 5.6 billion, or 15.6 per cent, since the same month last year.
Metalliferous ores and metal scrap was the commodity group that increased the most compared to June last year, with a rise of almost NOK 1.9 million. The exports value for this commodity is thereby about to return to the level before the financial crisis. The value of road vehicles increased by NOK 1 billion - of which passenger cars amounted to NOK 761 million.
The contribution to the increased import also came from petroleum and petroleum products, which showed an increase of NOK 948 million. Furthermore, chemicals and related products rose by NOK 827 millions while non-ferrous metals increased by NOK 604 million.
On the contrary, other transport equipment dropped by almost NOK 1.3 billion compared to June last year. This group thereby had an opposite impact on the import figures. Imports of machinery also fell, where of general industrial machinery the most, down NOK 320 million.
Tables:
- Table 1 Imports of commodities, ships and oil platforms excluded. June and January - June 2009 and 2010 NOK million
- Table 2 Exports of commodities, ships and oil platforms excluded. Juni and January-June 2009 and 2010 Preliminary figures. NOK million
- Table 3 Trade with countries and regional groups of countries. January-June 2009 and 2010 Preliminary figures. NOK million
Trade surplus upOpen and readClose
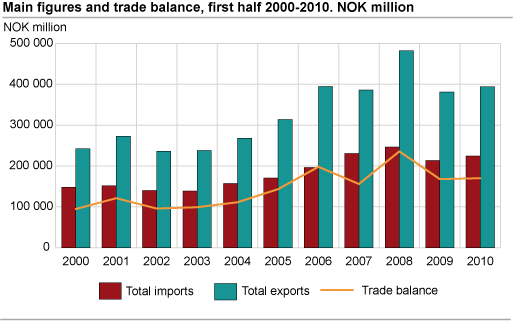
In the first half of 2010, exports reached NOK 390.5 billion and imports NOK 216.7 billion. This gave a trade surplus the first six months of NOK 173.7 billion, up NOK 8.1 billion from 2009.
The trade balance in the first half of 2010 increased by 5 per cent from the corresponding months in 2009. The increase was mainly due to a rise in crude oil exports, but the mainland exports also contributed to the increase. Imports also rose in this period.
Rising crude oil prices
In the first six months of 2010, the export value of crude oil came to NOK 140.3 billion. In 2009 the corresponding value was NOK 108.1 billion. The positive development in 2010 was mainly due to higher crude oil prises compared with the previous year. The average crude oil price was NOK 339 per barrel in the first half of 2009 compared to NOK 472 per barrel in 2010. On the other hand, the number of exported barrels of crude oil declined, from 319 million in 2009 to 297 million barrels this year.
Low natural gas prices
Natural gas exports came to NOK 84.3 billion the first half this year, a decrease of NOK 31.2 billion from the corresponding period in 2009. The main cause of this development was far lower prices for natural gas. So far this year, Norway has exported 52.3 billion Standard Cubic Metres (Sm3) of natural gas in gaseous state. This is 2.9 billion Sm3 more than in the same period last year.
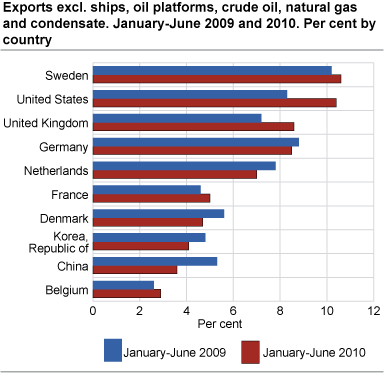
Exports up first half
The export value of goods excluding ships, oil platforms, crude oil, condensates and natural gas reached NOK 163.2 billion in the first half of 2010. This is an increase from NOK 146.7 billion the six first months last year.
Most main export groups increased in the first half this year compared with the same period last year. Exports of manufactured goods totalled NOK 36.3 billion, up 21 per cent. Especially metals rose in this period, ending at NOK 26.8 billion. Chemicals and related products went up 17 per cent, ending at NOK 21.8 billion. Most groups contributed to this growth.
Within the exports of mineral fuels, lubricants and related materials, refined mineral products together with liquefied propane and butanes increased the first half.
In the opposite direction, exports of machinery and transport equipment decreased, and came to NOK 33.7 billion – a decline of NOK 4.3 billion. Within this group, machinery specialised for particular industries and general industrial machinery fell, but also electrical machinery and power generating machinery declined.
Exports of miscellaneous manufactured goods also declined in the first half of this year, to NOK 10.1 billion - a decrease of 6 per cent.
Increase in exports of fish
The export value of fish came to NOK 23.4 billion the first half this year, up NOK 3.5 billion or 18 per cent from last year.
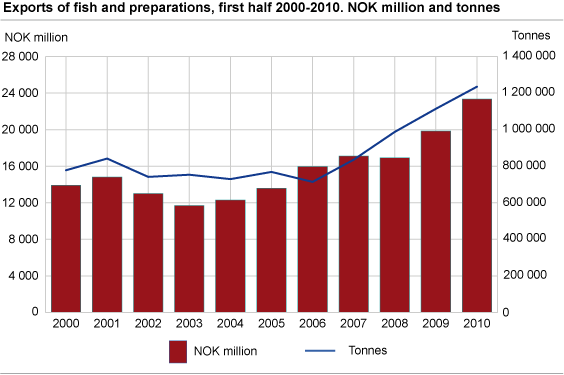
Russia was our largest market for fish exports in the first half of 2010, both in terms of quantity and value. So far this year, Russia has imported Norwegian fish for NOK 2.4 billion. In second and third place we find France and Denmark.
Fish disease in Chile has opened the American marked, and Norways fish exports to the US nearly doubled in value the first half this year - ending at NOK 1.2 billion.
Our most important fish commodity so far, has been fresh farmed salmon, with a value of NOK 10.1 billion. Besides we also export large quantities of frozen herring, capelin and mackerel.
Stable imports – cars increase
Imports of goods in the first half of 2010, excluding ships and oil platforms, amounted to NOK 216.7 billion. Corresponding figures for the previous year was NOK 208.5 billion. This is an increase of 4 per cent.
During January - June this year, imports of manufactured goods reached NOK 33.4 billion, up 2 per cent from last year. Within this group, the import of metals made up NOK 5.9 billion and thereby doubled its value compared with the corresponding period in 2009. .
Inedible crude materials increased by NOK 5.8 billion and came to NOK 18 billion. Imports of metal scrap confirm the value within this group.
Imports of chemicals and related products as well as food and live animals also increased from January to June this year.
On the other hand, imports of machinery and transport equipment went down 3 per cent the six first months this year, ending at NOK 79.1 billion. Here, all subgroups declined, except imports of road vehicles. Imports of passenger cars show a considerable increase. In the six first months this year, both value (up 70 per cent) and number (up 62 per cent or about 34 200 cars) increased. German and Japanese cars alone made up half of the imports in this year’s six first months. Now, car imports is on the same level as in the first half of 2008 - before the global financial crisis.
The import value of miscellaneous manufactured goods also declined in the first half of 2010 compared with the previous year - down 3 per cent to NOK 31.7 billion. Imports of furniture went up a bit, while clothing and footwear decreased.
The EU our most important trade area – Asia increases
The countries in the European Union is our most important trade area. In the first half of 2010, trade with the EU amounted to 66.3 per cent of our imports, excluding ships and oil platforms. The export to these countries, excluding ships, oil platforms, crude oil, condensates and natural gas accounted for 61.7 per cent of total exports.
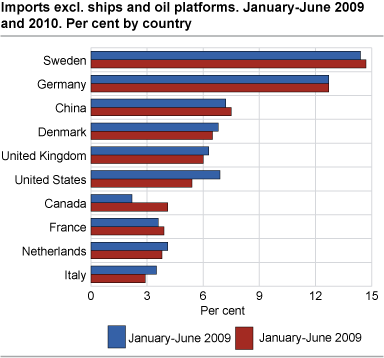
Sweden was our largest trading partner, both for imports and exports. Imports from Sweden halfway through the year came to NOK 31.8 billion and exports to NOK 17.3 billion. If we also include commodities from the continental shelf, we exported the most to the United Kingdom, followed by the Netherlands, Germany, France and Sweden.
In the six first months of 2010, our Asian imports increased by 4 per cent. Among these countries, China dominates, with Japan in second place. Imports from China ended at NOK 16.2 billion in the first half this year, up 8 per cent from the same period last year. The most important commodities from China are clothing (NOK 2.8 billion), office machines and automatic data equipment (NOK 2.4 billion) together with telecommunications apparatus (NOK 2 billion). As an example, almost every third mobile telephone imported in the first half of 2010, came from China.
Tables
Contact
-
Information services external trade
E-mail: utenrikshandel@ssb.no
-
Nina Rolsdorph
E-mail: nina.rolsdorph@ssb.no
tel.: (+47) 41 51 63 78
-
Jan Olav Rørhus
E-mail: jan.rorhus@ssb.no
tel.: (+47) 40 33 92 37