Content
Published:
This is an archived release.
Record high trade surplus in 2005
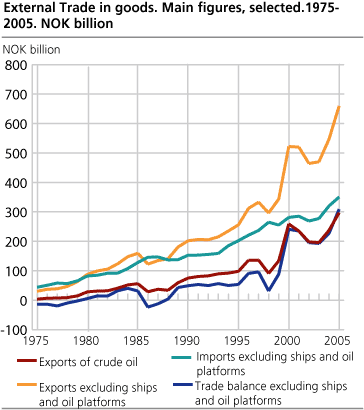
Norway's exports of goods reached NOK 659.3 billion increasing by NOK 112.0 billion or 20.5 per cent from 2004. Imports amounted to NOK 350.4 billion, an increase of NOK 30.1 billion or 9.4 per cent. The record high trade balance came to NOK 308.9 - up 36.1 per cent from 2004.
The figures are preliminary and exclude the imports and exports of ships and oil platforms.
Both imports, exports and the trade surplus represent the highest values ever recorded. It is mainly exports and therefore also the trade surplus that increased strongly.
| External trade in goods, excl. ships and oil platforms. NOK million |
| January-December |
Change in
per cent |
December |
Change in
per cent |
||||||||||||||||||||||||||||||||||||
|---|---|---|---|---|---|---|---|---|---|---|---|---|---|---|---|---|---|---|---|---|---|---|---|---|---|---|---|---|---|---|---|---|---|---|---|---|---|---|---|
| 2004 | 2005 | 2004 | 2005 | ||||||||||||||||||||||||||||||||||||
| 1 Imports | 320 218 | 350 366 | 9.4 | 27 340 | 30 794 | 12.6 | |||||||||||||||||||||||||||||||||
| 2 Exports | 547 229 | 659 262 | 20.5 | 44 985 | 62 118 | 38.1 | |||||||||||||||||||||||||||||||||
| Of which | |||||||||||||||||||||||||||||||||||||||
| Crude oil | 237 468 | 297 044 | 25.1 | 17 132 | 28 250 | 64.9 | |||||||||||||||||||||||||||||||||
| Natural gas | 74 017 | 97 079 | 31.2 | 7 620 | 10 142 | 33.1 | |||||||||||||||||||||||||||||||||
| Condensates | 9 953 | 13 447 | 35.1 | 812 | 1 302 | 60.3 | |||||||||||||||||||||||||||||||||
| 3 Exports excl. crude oil, natural gas and condensates | 225 791 | 251 691 | 11.5 | 19 421 | 22 425 | 15.5 | |||||||||||||||||||||||||||||||||
| 4 Trade balance (2-1) | 227 011 | 308 895 | 36.1 | 17 645 | 31 324 | 77.5 | |||||||||||||||||||||||||||||||||
| 5 Trade balance excl. oil, natural gas and condensates (3-1) | -94 427 | -98 675 | . | -7 919 | -8 369 | . | |||||||||||||||||||||||||||||||||
Imports for December 2005 increased by NOK 3.5 billion - up 12.6 per cent - compared with December 2004. Exports for the same period rose by NOK 17.1 billion, up 38.1 per cent mainly due to the increase in value of the petroleum products (crude oil, condensates and natural gas).
Last year's high prices of crude oil lead to a growth of NOK 60 billion for this product compared with 2004. The number of exported barrels fell from 927 million to 845 million. The average price per barrel rose from NOK 256 in 2004 to NOK 352 in 2005. Close to half of the crude oil was exported to the United Kingdom.
Increase in seasonally adjusted figures
Seasonally adjusted figures for the exports of goods, excluding ships and oil platforms, in the forth quarter increased by 1.4 per cent compared with the third quarter. Corresponding figures for the imports showed a rise of 2.4 per cent. Looking at the change from November to December 2005 for exports, excluding ships, oil platforms, crude oil, condensates and natural gas, there was a growth of 13.7 per cent. In the same period, imports, excluding ships and oil platforms, rose by 7.3 per cent.
Higher exports of fish, mineral products and electricity
The total export value, excluding ships, oil platforms, crude oil, condensates and natural gas, totalled NOK 251.7 billion in 2005 compared with NOK 225.8 billion in 2004. This represented a growth of 11.5 per cent.
The export of fish rose by 13.7 per cent and came to NOK 31.0 billion in 2005. Our main export destination for fish was Russia both with regard to value and volume. The Russian market bought Norwegian fish worth NOK 3.7 billion last year compared with NOK 2.5 billion the previous year.
The French market came second followed by Denmark and Japan. Fish-farm bred salmon was the most important fish product. Export value for salmon increased from NOK 8.8 billion in 2004 to NOK 11.1 billion in 2005. Other important types of fish were frozen herring and mackerel.
A significant export group was refined mineral products rising by a strong 43.7 per cent, up NOK 8.4 billion, mainly due to increase in prices. The export of electricity jumped by 294.9 per cent, equal to NOK 2.7 billion, in 2005 and the exported volume reached a 2002 level.
Changes were also recorded within the export of different types of machinery. The export of power generating machinery rose by 43.9 per cent, up NOK 1.4 billion, machinery specialized for particular industries went up by 18.3 per cent, up NOK 1.1 billion, and general industrial machinery rose by 12.4 per cent - up NOK 1.2 billion.
Whereas the export of iron and steel fell slightly, down 4.2 per cent, non-ferrous metals, on the other hand, rose slightly - up 3.9 per cent. Manufactures of metals increased substantially last year up 24.6 per cent.
Increased imports of industrial machinery, iron and steel
The total import value, excluding ships and oil platforms, amounted to NOK 350.4 billion in 2005 compared with NOK 320.2 billion in 2004. This represented a growth of 9.4 per cent.
Large changes can be found within iron and steel showing a growth of 28.6 per cent, up NOK 3.5 billion. Metalliferous ores and metal scrap grew by 18.1 per cent representing NOK 2.7 billion.
In the commodity group containing different chemicals the following growth can be found: Organic chemicals up 15.7 per cent or NOK 693 million, inorganic chemicals up 35.5 per cent or NOK 755 million and medicinal and pharmaceutical products - up 6.7 per cent or NOK 542 million.
The import of general industrial machinery showed a substantial increase of 35.8 per cent equal to NOK 5.5 billion. The number of imported of passenger cars, on the other hand, fell from 167 400 in 2004 to 165 300 in 2005, whereas the import of furniture went up by 10.5 per cent - up NOK 817 million.
Main trade partners
Trade in goods with the EU showed an upturn of NOK 16.0 billion for imports and NOK 18.5 billion respectively for exports from 2004 to 2005. The EU supplied us with 69.4 per cent of all the goods we bought and received 70.9 per cent of all the goods we exported in 2005.
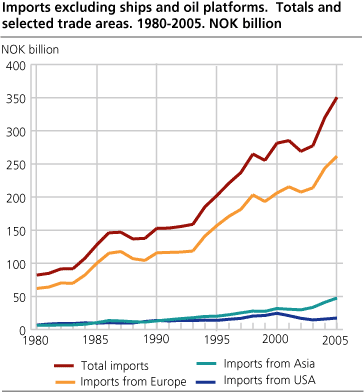
Norway's main trade partner continues to be Sweden, both with regard to imports and exports of goods, excluding ships and oil platforms. In 2005, imports from and exports to Sweden stood at NOK 51.5 billion and NOK 31.9 billion respectively accounting for 14.7 and 12.7 per cent of our total imports and exports. Norway's second largest trade partner with regards to imports is Germany followed by Denmark, the United Kingdom, China and USA. A similar ranking for the exports places the United Kingdom second followed by Germany, USA, the Netherlands and Denmark.
Imports from Asia grew by 15.2 per cent from 2004 to 2005. China is the dominating country within this trade area increasing their exports to Norway from NOK 16.2 billion to NOK 19.1 billion, up 18.2 per cent. They now have a proportion of 5.5 per cent of total Norwegian imports. Clothing was the main commodity group, amounting to NOK 4.3 billion and making China our main supplier of clothing. 36.4 per cent of the total import of clothes came from China followed by Turkey - 8.6 per cent. As in 2004 the second most important commodity groups from China in 2005 were office machines and telecommunications apparatus.
Tables:
- Table 1 Imports of commodities, ships and oil platforms excluded. December and January-December 2004 and 2005. Preliminary figures. NOK million
- Table 2 Exports of commodities, ships and oil platforms excluded. December and January-December 2004 and 2005. Preliminary figures. NOK million
- Table 3 Trade with countries and regional groups of countries. January-December 2004 and 2005. Preliminary figures. NOK million
Contact
-
Information services external trade
E-mail: utenrikshandel@ssb.no
-
Nina Rolsdorph
E-mail: nina.rolsdorph@ssb.no
tel.: (+47) 41 51 63 78
-
Jan Olav Rørhus
E-mail: jan.rorhus@ssb.no
tel.: (+47) 40 33 92 37