Content
Published:
This is an archived release.
Strong increase in external trade
Norwegian imports came to NOK 29.5 billion in November, an increase of 21.3 per cent from November 2003. Exports reached a peak of 51,4 billion, an increase of 25.0 per cent. Norway's imports of goods from China are 30 per cent higher than by November last year.
The import value in November at NOK 29.5 billion is the third highest value by month, next to imports last March and June. In the export total of NOK 51.4 billion - the highest ever except for November 2000 - 29.7 billion came from crude oil, natural gas and natural gas condensates. The export value of petroleum was 27.4 per cent higher and traditional goods 21.9 per cent higher than in November 2003.
| External Trade in Goods, excl. Ships and Oil Platforms. NOK million |
| January-November | Change, per cent | November | Change, per cent | ||||||||||||||||||||||||||||||||||||
|---|---|---|---|---|---|---|---|---|---|---|---|---|---|---|---|---|---|---|---|---|---|---|---|---|---|---|---|---|---|---|---|---|---|---|---|---|---|---|---|
| 2003 | 2004 | 2003 | 2004 | ||||||||||||||||||||||||||||||||||||
| Imports | 253 612 | 293 038 | 15.5 | 24 335 | 29 514 | 21.3 | |||||||||||||||||||||||||||||||||
| Exports | 429 291 | 503 378 | 17.3 | 41 148 | 51 427 | 25.0 | |||||||||||||||||||||||||||||||||
| Of which | |||||||||||||||||||||||||||||||||||||||
| Crude oil | 178 103 | 225 686 | 26.7 | 16 005 | 21 203 | 32.5 | |||||||||||||||||||||||||||||||||
| Natural gas | 56 027 | 62 155 | 10.9 | 5 939 | 7 274 | 22.5 | |||||||||||||||||||||||||||||||||
| Condensates | 9 822 | 9 221 | -6.1 | 1 383 | 1 230 | -11.0 | |||||||||||||||||||||||||||||||||
| Exports excl. crude oil, natural gas and condensates | 185 339 | 206 315 | 11.3 | 17 821 | 21 720 | 21.9 | |||||||||||||||||||||||||||||||||
| Trade balance (2-1) | 175 679 | 210 340 | 19.7 | 16 813 | 21 913 | 30.3 | |||||||||||||||||||||||||||||||||
| Trade balance excl. oil, natural gas and condensates (3-1) | -68 273 | -86 723 | . | -6 514 | -7 794 | . | |||||||||||||||||||||||||||||||||
Trade increase from October to November
Adjusted for seasonality, the value of imports of traditional goods increased by 2.6 per cent from October to November, but was 2.7 per cent lower during the last three months compared with the previous three-month period. The value of traditional exports increased by 4.2 per cent from October. The export of metals rose by 5.6 per cent, whereas the export of fish declined by 7.5 per cent. During the last three-month period the adjusted export of traditional goods was 2.3 per cent higher than in the summer period from June to September.
Goods from China
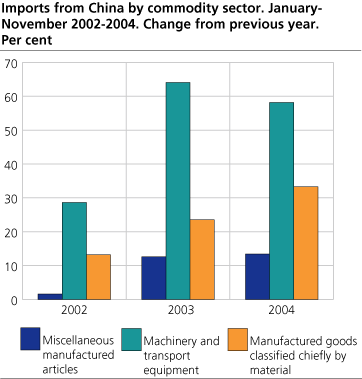
By November, Norway has imported traditional goods from China in the amount of NOK 14.8 billion, an increase of 30.1 per cent compared with the same period last year. China is now Norway's fifth largest supplier of goods, only surpassed by Sweden, Germany, Denmark and the United Kingdom.
|
Imports from China by commodity sector. January-November 2001-2004.
NOK million |
| 2001 | 2002 | 2003 | 2004 | ||||||||||||||||||||||||||||||||||||
|---|---|---|---|---|---|---|---|---|---|---|---|---|---|---|---|---|---|---|---|---|---|---|---|---|---|---|---|---|---|---|---|---|---|---|---|---|---|---|---|
| Miscellaneous manufactured articles | 5 299.3 | 5 382.7 | 6 062.5 | 6 876.0 | |||||||||||||||||||||||||||||||||||
| Machinery and transport equipment | 1 623.3 | 2 088.1 | 3 426.0 | 5 421.1 | |||||||||||||||||||||||||||||||||||
| Manufactured goods classified chiefly by material | 993.6 | 1 125.0 | 1 389.0 | 1 852.0 | |||||||||||||||||||||||||||||||||||
Delineations
The figures are exclusive of ships and mobile oil platforms, the same as traditional goods on the import side. For exports, traditional goods are also exclusive of crude oil, natural gas and natural gas condensates.
Tables:
- Table 1 Imports of traditional commodities in November and January to November 2003 and 2004. Preliminary figures. Million NOK
- Table 2 Exports of commodities, ships and oil platforms excluded, in November and January-November 2003 and 2004. Preliminary figures. NOK million
- Table 3 Trade with countries and regional groups of countries. Traditional commodities. January-November 2003 and 2004. Preliminary figures. NOK million
Contact
-
Information services external trade
E-mail: utenrikshandel@ssb.no
-
Nina Rolsdorph
E-mail: nina.rolsdorph@ssb.no
tel.: (+47) 41 51 63 78
-
Jan Olav Rørhus
E-mail: jan.rorhus@ssb.no
tel.: (+47) 40 33 92 37

