Content
Published:
This is an archived release.
Increase in imports
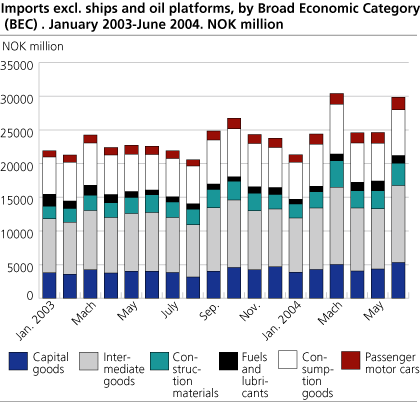
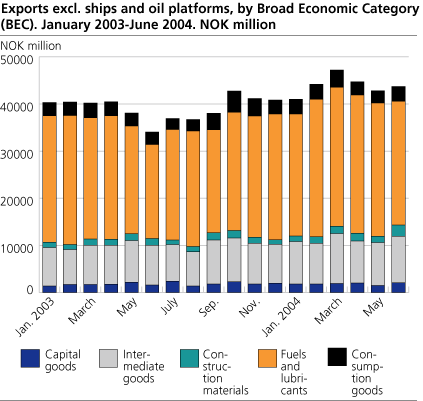
Norwegian imports reached a peak of NOK 29.8 billion in June, an increase of 32.2 per cent from June 2003. Exports came to NOK 43.7 billion, an increase of 28.3 per cent.
The import value recorded in June is the highest ever, except for the record high in March. In the export total of NOK 43.7 billion, 24.3 billion came from crude oil, natural gas and natural gas condensates, while 19.4 billion came from traditional goods. The export value of petroleum was 34.1 per cent higher and traditional goods 21.8 per cent higher than in June 2003. The increases are, however, partly due to the Whitsun holidays' in June last year.
| External Trade in Goods, excl. Ships and Oil Platforms. NOK million |
| January-June |
Change,
per cent |
June |
Change,
per cent |
||||||||||||||||||||||||||||||||||||
|---|---|---|---|---|---|---|---|---|---|---|---|---|---|---|---|---|---|---|---|---|---|---|---|---|---|---|---|---|---|---|---|---|---|---|---|---|---|---|---|
| 2003 | 2004 | 2003 | 2004 | ||||||||||||||||||||||||||||||||||||
| Imports | 135 216 | 155 177 | 14.8 | 22 574 | 29 838 | 32.2 | |||||||||||||||||||||||||||||||||
| Exports | 233 684 | 263 636 | 12.8 | 34 068 | 43 713 | 28.3 | |||||||||||||||||||||||||||||||||
| Of which | |||||||||||||||||||||||||||||||||||||||
| Crude oil | 99 468 | 113 722 | 14.3 | 13 629 | 18 708 | 37.3 | |||||||||||||||||||||||||||||||||
| Natural gas | 30 525 | 35 984 | 17.9 | 3 536 | 4 945 | 39.9 | |||||||||||||||||||||||||||||||||
| Condensates | 5 161 | 4 995 | -3.2 | 976 | 667 | -31.7 | |||||||||||||||||||||||||||||||||
| Exports excl. crude oil, natural gas and condensates | 98 530 | 108 935 | 10.6 | 15 926 | 19 393 | 21.8 | |||||||||||||||||||||||||||||||||
| Trade balance (2-1) | 98 468 | 108 459 | 10.1 | 11 493 | 13 875 | 20.7 | |||||||||||||||||||||||||||||||||
| Trade balance excl. oil, natural gas and condensates (3-1) | -36 685 | -46 242 | . | -6 648 | -10 445 | . | |||||||||||||||||||||||||||||||||
Traditional goods seasonally adjusted
Adjusted for seasonality, the value of imports increased by 6.0 per cent from May to June and by 7.0 per cent during the last three months compared with the previous three-month period. The value of exports declined slightly during the same period by 0.4 per cent. The levelling out was partly caused by lower exports of fish and non-ferrous metals. From May to June seasonally adjusted exports rose by 6.1, partly due to increases in fish and metals.
Delineation
The figures are exclusive of ships and oil platforms, the same as traditional goods on the import side. For exports, traditional goods are also exclusive of crude oil, natural gas and gas condensates.
Tables:
- Table 1 Imports of traditional commodities in June and January to June 2003 and 2004. Preliminary figures. NOK million
- Table 2 Exports of commodities, ships and oil platforms excluded, in June and January-June 2003 and 2004. Preliminary figures. NOK million
- Table 3 Trade with countries and regional groups of countries. Traditional commodities. January-June. 2003 and 2004. Preliminary figures. NOK million
Contact
-
Information services external trade
E-mail: utenrikshandel@ssb.no
-
Nina Rolsdorph
E-mail: nina.rolsdorph@ssb.no
tel.: (+47) 41 51 63 78
-
Jan Olav Rørhus
E-mail: jan.rorhus@ssb.no
tel.: (+47) 40 33 92 37